
The ICT 2022 Model: A Complete Breakdown
The ICT 2022 model gets searched constantly, and yet most of the content ranking for it is either a ten-minute YouTube summary or a screenshot dump with no real explanation of why any of it works. After 10+ years of trading ICT concepts, passing an FTMO Challenge, and spending more hours than I care to count studying Michael Huddleston's material, I want to give you the structured breakdown this topic actually deserves.
Key Takeaway: The ICT 2022 model is a time-based, liquidity-aware trading framework that combines killzone timing, displacement, fair value gaps, and order blocks into a repeatable entry sequence. It is not a strategy in the traditional sense. It is a logic framework for reading where institutional order flow is likely to show itself during specific market windows.
What the ICT 2022 Model Actually Is
Let's clear something up first. The "2022 model" is not an official product name from ICT. It refers to the trading model Michael Huddleston began teaching and refining most explicitly during his 2022 mentorship content. Traders searching "ict 2022 model explained" or "2022 model ict" are largely looking for the same thing: a coherent summary of how the components he taught that year fit together as a usable framework.
At its core, the model is built on three ideas:
- Time matters more than price alone. The model only looks for setups during specific killzones: the London open (2:00 AM to 5:00 AM New York time) and the New York open (8:30 AM to 11:00 AM New York time). Outside of those windows, the model tells you to stay flat.
- Displacement is the trigger. A valid setup begins with a strong, impulsive move away from a liquidity pool. Without displacement, there is no setup.
- The entry comes on the return. After displacement, price leaves behind a fair value gap (FVG). The model calls for entering when price retraces into that FVG, ideally overlapping with an order block from the same displacement move.
Those three ideas sound simple. Applying them consistently is where it gets hard, and I will explain exactly why below.
The Core Components, One by One
Killzones
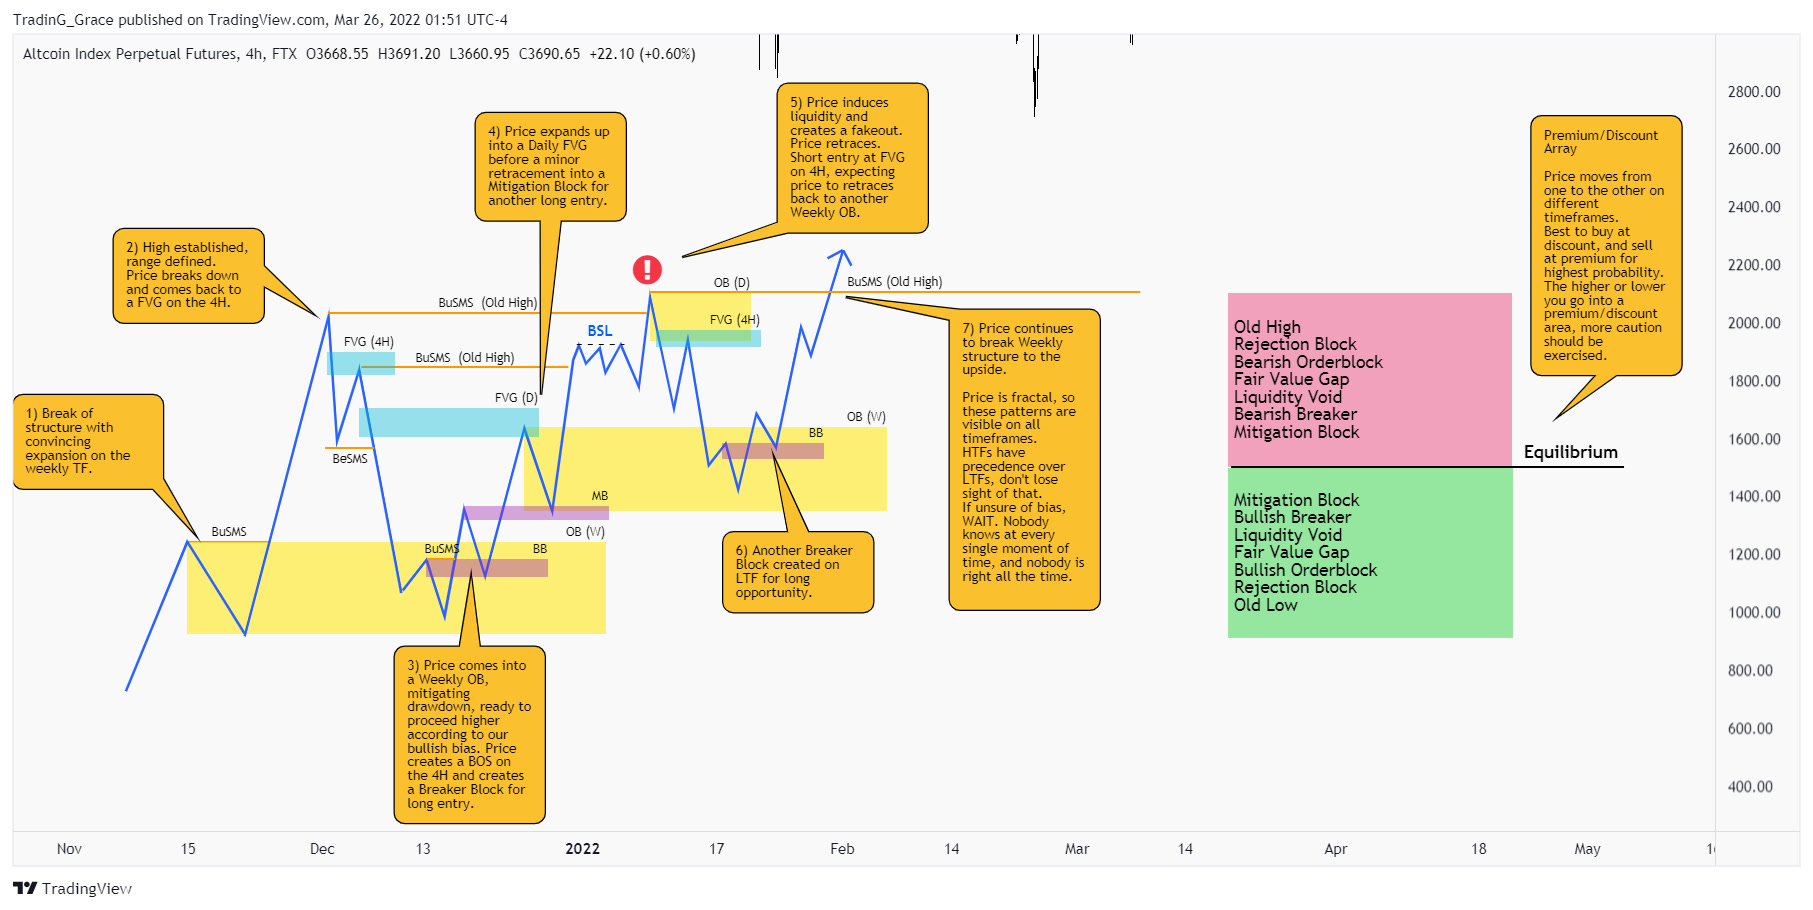
Killzones are not arbitrary. They align with real institutional participation windows: London open is when European banks and institutional desks come online; New York open is when US liquidity floods in and often reverses or extends the London session's directional bias. TradingView's session tools let you mark these visually if you are not already doing so.
The practical implication: if you are scanning for an ICT 2022 model setup at 1:00 PM New York time, you are already off-script. The model is a morning framework. That is a feature, not a limitation.
Displacement and the Break of Structure
Displacement is a sharp, one-sided move that breaks a prior swing high or low with conviction. On a 15-minute chart it looks like a large-bodied candle or sequence of candles that do not overlap much with each other. Choppy, overlapping candles are not displacement. That distinction matters enormously in live markets where it is tempting to call any move "displacement" to justify a trade you already want to take.
The break of structure (BOS) that accompanies displacement tells you which direction the model is biased for that session. A clean BOS to the upside means you are looking for longs on the retracement. A clean BOS to the downside means you are looking for shorts.
Fair Value Gaps
A fair value gap forms when price moves so quickly that a three-candle sequence leaves an imbalance: the low of candle one is above the high of candle three (for a bullish FVG), or the high of candle one is below the low of candle three (for a bearish FVG). This imbalance represents a price range where buying and selling were one-sided. The model anticipates that price will return to "fill" that gap, at least partially, before continuing in the direction of displacement.
For a deeper look at why FVGs behave differently in live markets than in backtests, this post on why your FVGs work in backtests but not live is worth your time.
Order Blocks
An order block within the 2022 model is the last down-close candle before a bullish displacement (for a buy setup), or the last up-close candle before a bearish displacement (for a sell setup). The logic is that institutional orders were placed in that candle's price range and have not been fully filled. When price returns to that zone, the model expects those orders to defend the level and continue the original displacement direction.
The best entries occur when the order block and the FVG overlap. That overlap is the premium zone inside a discount (for longs) or the discount zone inside a premium (for shorts). It is a confluence point, and in my experience it is where the highest-probability ICT 2022 model entries live.
A Worked Example: EURUSD at the London Open
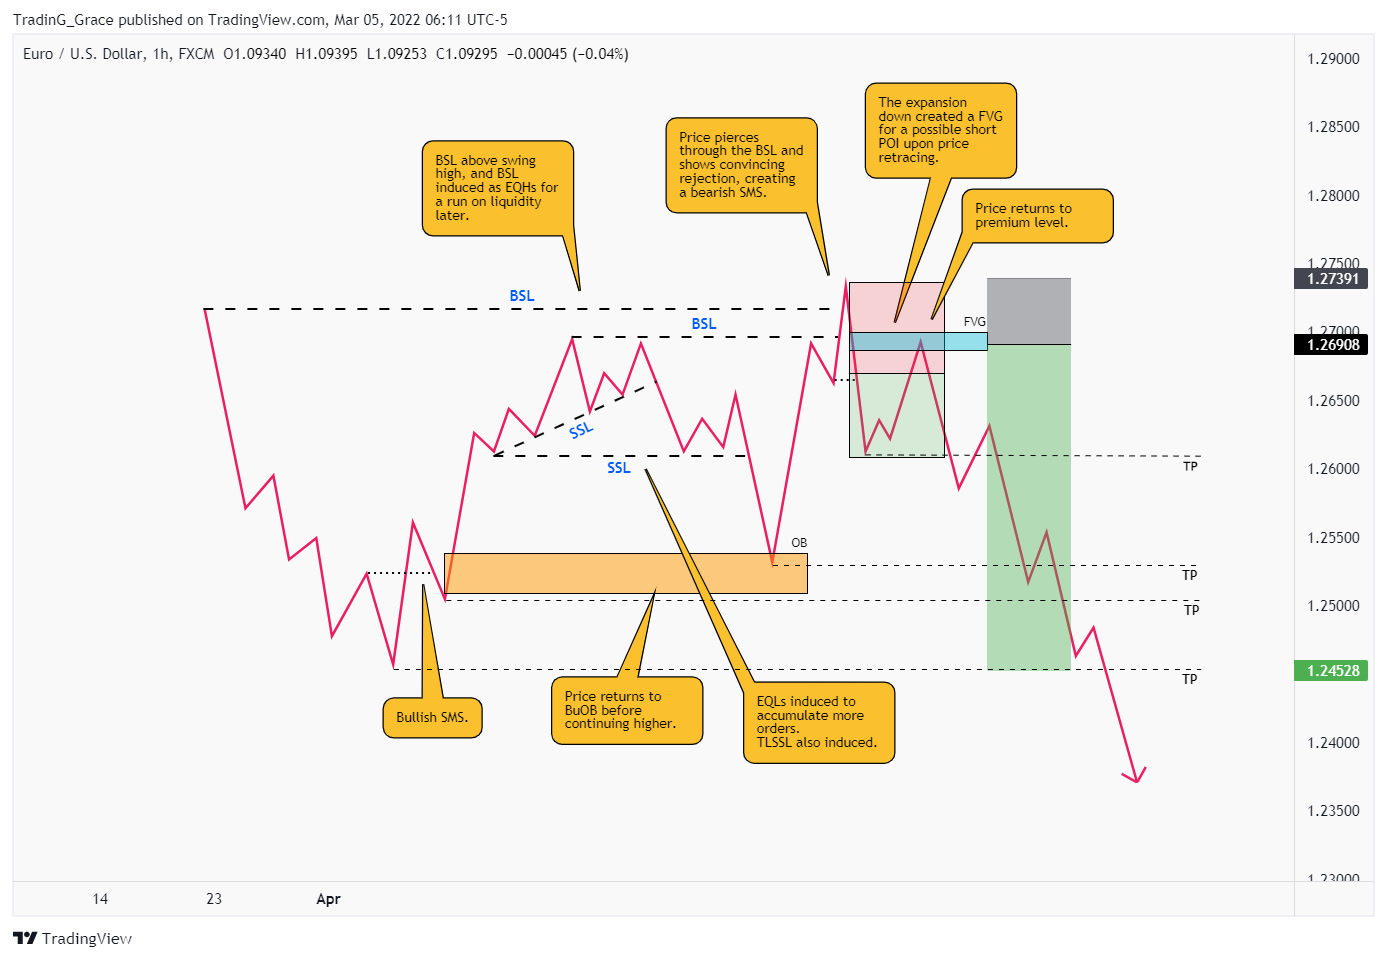
Here is the kind of setup I mean. Picture EURUSD heading into the London open. On the 15-minute chart, there is a clear swing low sitting just below yesterday's Asian session range, acting as short-side liquidity. Right at 2:00 AM New York time, price sweeps that low with a quick, sharp wick, then immediately reverses and drives upward with three large bullish candles in a row. That sequence breaks the prior swing high: a clean bullish BOS.
Those three candles leave a fair value gap between the low of the first candle and the high of the third. The last bearish candle before the explosive move up is your order block. It sits inside the FVG range.
Price then retraces. It comes back into the FVG, touching into the order block's price range. This is your entry zone. You enter long somewhere inside the FVG, ideally at the midpoint of the gap or at the order block's high.
Where does the stop go? Below the swing low that was swept at the start of the sequence. That sweep was the liquidity grab that fuelled the displacement. If price goes back through that level, the model's premise is invalidated. The stop placement is not arbitrary: it is defined by the structure of the setup itself.
Where does the target go? The next significant liquidity level above: a prior swing high, an equal high, or a sell-side imbalance sitting above current price. The model is not about fixed R multiples. It is about reading where the next pool of liquidity sits and letting that define the target.
Use a risk calculator to size the position correctly once you have your stop distance and target defined.
The Nuanced Take Most ICT Creators Skip
Here is something I rarely see discussed: the ICT 2022 model is a sequence, and most traders treat it as a checklist.
The difference is significant. A checklist approach says: "I see an FVG, I see an order block, I see it is in the killzone, I take the trade." A sequence approach says: "Did displacement happen first? Did it sweep liquidity first? Did the BOS occur with conviction? Only then do I look for the FVG and OB confluence."
Without the liquidity sweep preceding the displacement, you do not have a 2022 model setup. You have a random FVG in a random order block at a vaguely relevant time of day. The sweep is what gives the displacement its institutional context. Remove that, and the edge degrades sharply.
I used to get this wrong too. Early on, I would skip the sweep requirement and wonder why the same visual pattern produced inconsistent results. The sweep is not decorative. It is the reason the displacement happens at all.
The Pattern That Keeps Traders Stuck
There is a type of trader who studies the ICT 2022 model intensely, marks every FVG and order block on the chart, and still gets stopped out repeatedly. When you look at their charts, the problem is almost always the same: they are entering in a premium while expecting a bullish continuation. They see an FVG, they see an order block, and they enter, but they have not checked where that FVG sits relative to the broader range.
If price is trading in the upper 50% of a dealing range, bullish FVGs and order blocks are traps for longs, not entries. The 2022 model requires you to know the relative position of price, not just the local structure. Premium or discount? That is the question that filters the genuine setups from the noise.
A Practical Step-by-Step Framework
Here is exactly how I approach identifying an ICT 2022 model setup from scratch:
- Mark the dealing range. On the 1-hour or 4-hour chart, identify the most recent significant swing high and low. Everything above the 50% level (equilibrium) is premium. Below is discount.
- Identify the daily bias. Use the daily chart to determine whether you are in a bullish or bearish environment. Only take model setups that align with the higher timeframe bias.
- Wait for the killzone. Set an alert for 2:00 AM and 8:30 AM New York time. Do nothing outside those windows.
- Watch for a liquidity sweep. Look for price to run stops at a clear swing high or low before reversing.
- Confirm displacement and BOS. The reversal must be sharp, impulsive, and must break a prior swing point.
- Mark the FVG and order block. Identify the gap left by displacement and the last opposing candle before it.
- Wait for the return. Do not chase. Let price retrace into the FVG and order block overlap zone.
- Enter, with structure-defined stops and liquidity-defined targets. Use the swept low (or high) as your stop anchor. Use the next opposing liquidity pool as your target.
For those newer to ICT concepts generally, the crash course on the site covers the foundational vocabulary you will need to make sense of the above.
How the 2022 Model Fits Into a Broader ICT Framework
The 2022 model does not exist in isolation. It draws on concepts ICT has taught across different years: power of three (accumulation, manipulation, distribution), the importance of institutional reference points, and the relationship between time and price. If you want to understand why the model works at the killzones specifically, you need to understand how market makers accumulate positions during low-liquidity Asian sessions and then distribute during high-liquidity London and New York sessions. Investopedia's overview of forex market sessions is a solid primer if you want the macro-level context.
The 2022 model is also not the last word. ICT has continued to refine and add nuance to his teaching beyond 2022. But the 2022 model represents a mature, coherent snapshot of the framework, which is why it has become a reference point for so many traders and why it keeps generating search volume years later.
If you are working through how to apply any of this in your own trading and want structured guidance, the coaching plans on this site are worth looking at. And if you are not sure which format makes sense for where you are right now, booking a free discovery call is the logical next step before committing to anything.
For more on the ICT ecosystem and how to build a process around concepts like these, browse the trading insights section. The post on why backtesting never transfers to live trading is especially relevant if you have been drilling the 2022 model in a simulator and hitting a wall once you go live.
Harvest Wright
ICT Trading Coach · 10+ Years Experience
Harvest specializes in ICT methodology and has helped traders pass prop firm challenges, develop consistent strategies, and build the psychology needed for long-term profitability.
Book a Free Discovery Call →Take Your Trading to the Next Level
Get personalized 1-on-1 ICT coaching with Harvest Wright. Free discovery call, no commitment.
Book a Free Discovery CallFree ICT Funded-Trader Playbook
The setups, the pre-trade checklist, and the risk rules I use. Get it free.