
Why Your FVGs Work in Backtests, Not Live
There is a specific kind of frustration that comes after running a clean backtest. You have gone through hundreds of candles, marked every fair value gap with precision, noted your entries and exits, tallied the results, and the numbers look genuinely good. So you go live. And within two weeks, the same setups that looked surgical on replay are leaving you with a string of stopped-out trades, premature entries, and a gnawing feeling that maybe you misunderstood the concept entirely.
You did not misunderstand the concept. You misunderstood what a backtest actually tests.
Key Takeaway: A backtest validates your ability to identify a fair value gap, not your ability to trade one. The gap between those two skills is where live accounts go to die, and it comes down to three specific variables that historical replay physically cannot simulate.
I used to think backtest performance was a reasonable proxy for live performance. It is not, and the gap between the two is not random noise. It is structural. Let me walk you through exactly what is hiding inside that clean equity curve.
Myth, Reality, and What I Actually See: The Three-Layer Problem
Layer One: Your Fill Is Not the Chart
Myth: If price touched the fair value gap on your chart, you got filled at the top of that gap.
Reality: On a retail broker, you never actually trade the chart. You trade a spread-adjusted, latency-delayed approximation of it.
What I Actually See: Traders place their entry at the exact upper boundary of a fair value gap because that is where price touched on the 5-minute chart. What their broker actually filled was 1.2 to 2.5 pips below that boundary, depending on the session, the pair, and the spread at that moment. On a 10-pip FVG, that is not noise. That is 12 to 25 percent of the entire gap consumed before the trade has even started.
Here is why this matters structurally. A fair value gap is a three-candle imbalance. The body of candle one, the full range of candle two, and the body of candle three define the zone. The inefficiency you are trading lives in that gap. But the gap is not infinitely valid across its entire depth. Price often dips into the gap, tags a specific internal level, and reverses. If your actual fill is 2 pips deeper than the level price reacted to, you are no longer in the position you backtested. You are in a slightly different, worse position with the same stop.
In backtesting, you click the candle. The candle costs nothing. There is no spread. There is no latency. There is no partial fill on a smaller account at a bucket-shop broker at 7:03 AM when liquidity is still thin. The backtest is measuring your pattern recognition. Live trading measures your execution infrastructure.
The fix here is not complicated, but most people skip it. Before you trust a fair value gap strategy live, you need to document the realized fill deviation on at least 20 forward-tested trades in a demo account that mirrors your live broker's spread conditions. Not just identify the gaps, actually enter and record where you got filled versus where you intended. That number will tell you whether your edge survives execution reality.
Layer Two: Killzone Timing Is the Variable Backtests Flatten
Myth: A fair value gap that forms during the London session is equivalent to one that forms during the New York open, assuming the structure and confluences look the same.
Reality: The time of formation relative to the killzone window is one of the most significant reliability filters for FVGs, and static backtesting almost never isolates this variable.
What I Actually See: A very common pattern among traders working through early FVG application is indiscriminate session usage. The gap looks textbook. The structure is right. The gap is clean and untested. They enter. And price either blows straight through or sits in the gap for six hours going nowhere. What they did not account for is when in the session that gap formed and whether there was a displacement move with genuine institutional participation behind it.
FVGs that form in the first 30 to 45 minutes of the London or New York killzone carry a meaningfully different profile than gaps that form at 10:45 AM EST when the big directional move is already over and price is consolidating. In the killzone window, the displacement creating the gap is driven by a genuine shift in order flow. Outside that window, you are often just seeing a routine candle with an unbalanced range that happens to look like a valid imbalance.
The problem with backtesting is that you click through candles and you see both kinds. Because hindsight tells you which one worked, you subconsciously over-count the killzone examples and under-weight the non-killzone failures. This is not a discipline failure. It is how human memory actually works when reviewing historical data. You pattern-match to success.
For a practical filter: I separate FVG entries into two categories. First, gaps created during a confirmed killzone displacement, with the session open having already printed a clear directional bias. Second, everything else. The second category I watch but do not trade off the FVG alone. It needs additional confluence, specifically an unmitigated order block or a clear liquidity sweep, before it justifies an entry. This is not a rule I invented arbitrarily. It is the result of watching enough live setups to know where the edge actually concentrates.
If you want to go deeper on why ICT concepts can look perfect on paper but underdeliver live, the article on why knowing ICT concepts isn't making you money covers the broader framework problem that sits underneath this.
Layer Three: Watching a Live FVG Form Is Psychologically Nothing Like Clicking Through History
Myth: If you have backtested the pattern enough times, you will recognize it live and execute it the same way.
Reality: Recognition and execution under uncertainty are completely different cognitive processes, and live FVG formation is specifically designed to trigger premature entry.
What I Actually See: The most common and most damaging live execution error with fair value gaps is entering as the gap is forming rather than when price returns to it. This happens for a specific reason. When you are watching the market live, candle two of the three-candle imbalance sequence has a way of looking extremely compelling in real time. Price is moving fast. The gap is opening up. Every second you wait feels like money leaving. So traders enter into candle two's body, mid-displacement, rather than waiting for the retracement back into the gap later.
This is not laziness or ignorance. It is a predictable response to live price action, which has an urgency and momentum quality that is completely absent when you are clicking through static historical candles. In backtesting, candle three has already closed. You see the full three-candle sequence and calmly mark the gap. Live, you are inside candle two with no guarantee candle three will even complete the imbalance.
When a trader enters mid-displacement, they are no longer trading a fair value gap. They are trading momentum, and they are trading it with a stop placed as if they are in a precision FVG entry. The risk-to-reward that made the backtest look good is now broken before the trade even opens.
This is also related to why your order blocks keep getting swept in similar ways. The identification is fine. The execution timing under live conditions is what collapses the premise.
A Worked Example: EURUSD, London Open
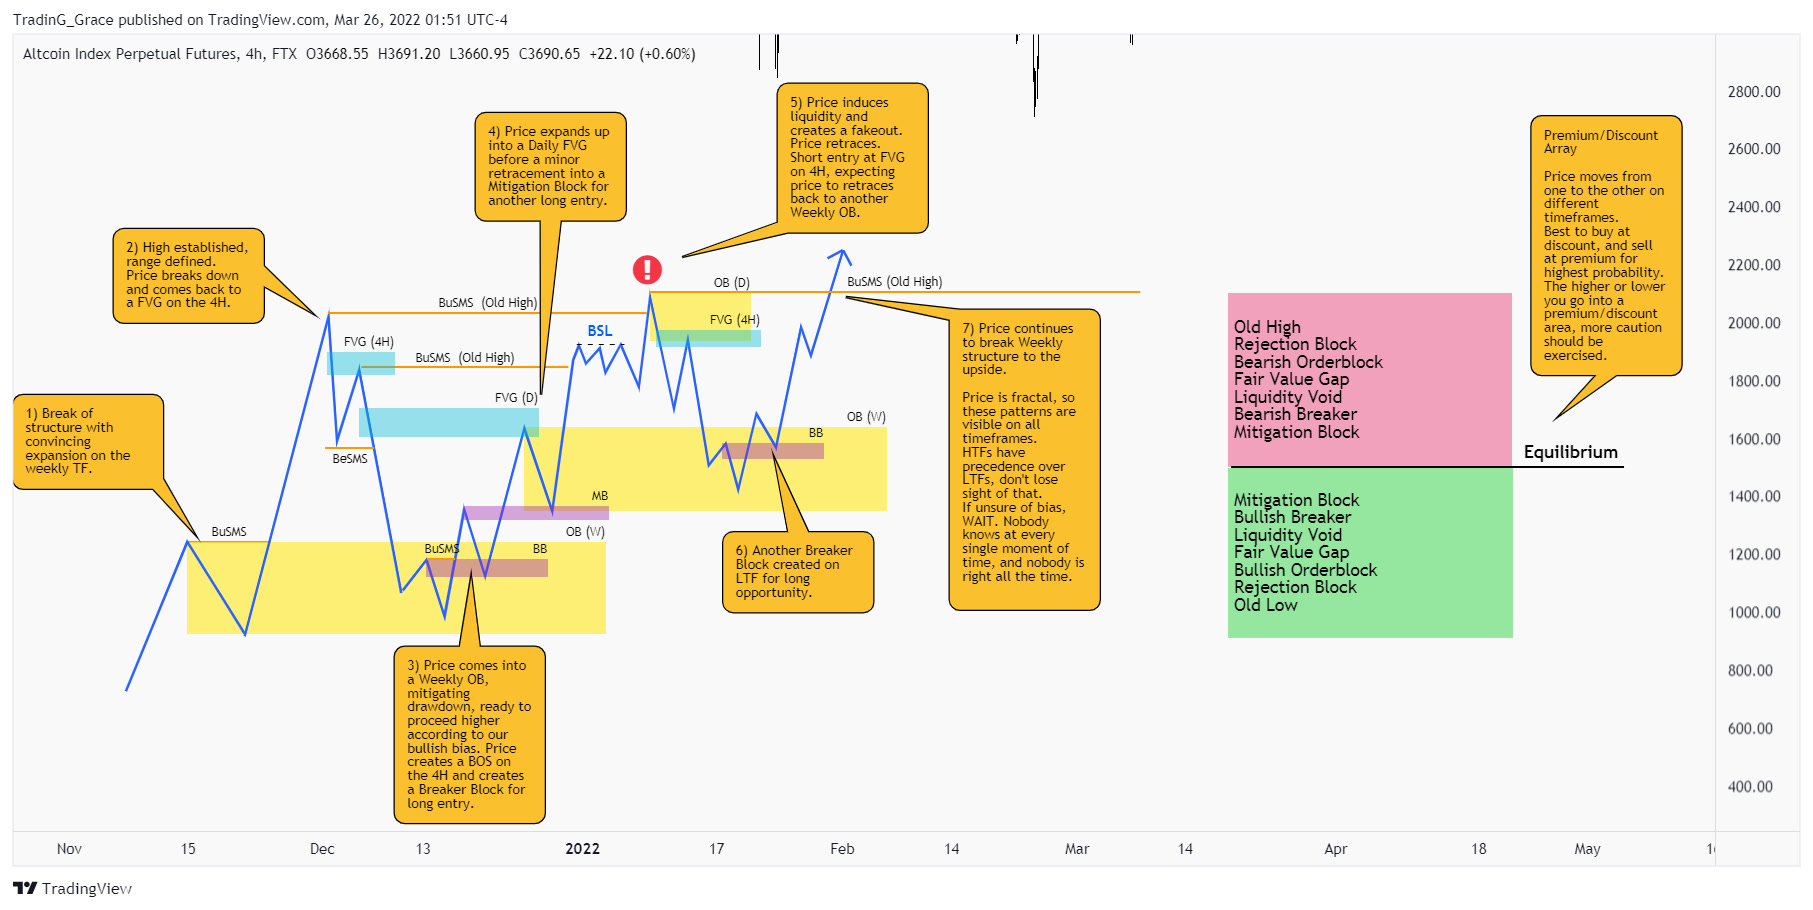
Here is the kind of setup I mean when I talk about a properly timed FVG entry versus a premature one.
Picture EURUSD at the London open. The previous New York session closed with a clean low, a clear level where stops would have accumulated. Coming into the London killzone, price sweeps that low sharply in the first 20 minutes, then reverses with a three-candle sequence on the 5-minute chart. Candle one prints a bearish close. Candle two prints a large bullish body with significant range, leaving a gap between candle one's low and candle three's high. Candle three closes bullish, confirming the displacement. You now have a fair value gap sitting roughly 15 pips below the current market price.
The correct entry is not chasing price as candle two prints. The correct entry is a limit order placed at the upper boundary of that gap, with the stop loss set below the swept low from the previous session, because that is the level that defines whether the displacement was genuine. If price comes back and takes out the low that triggered the displacement, the premise is wrong. The target is the Asia high that sits above, which represents the dealing range objective for the session.
The backtest version of this: you click the sequence, mark the gap, note the entry, and it all looks clean. The live version: you watched candle two print in real time, felt the urgency, entered 8 pips too early into candle two's body, and your "stop below the swept low" is now 8 pips wider than it looked in the backtest, destroying the R multiple.
Same concept. Same chart pattern. Completely different trade.
The Contrarian Take Most Creators Miss
Here is the thing about fair value gap content across YouTube and trading forums in 2026: almost all of it focuses on identification. Where is the gap? How do you mark it? What timeframe? And identification is genuinely the easiest part. After enough screen time, most traders can spot a valid FVG with reasonable accuracy.
The assumption underneath all that identification-focused content is that identifying the setup equals being able to trade it. This assumption is wrong in a specific, structural way. Backtesting rewards identification skill. Live trading rewards execution skill. They are correlated but they are not the same thing, and you cannot develop execution skill through historical replay.
I have seen traders with years of backtest data, genuinely impressive backtests, clean documentation, and a live record that looks like a different strategy entirely. The backtest was not wrong. It was measuring the wrong thing.
For context on how this fits into the bigger picture of ICT concept application, the follow-up piece on why knowing ICT concepts still isn't enough is worth reading alongside this one.
A Practical Framework for Forward-Testing FVGs the Right Way
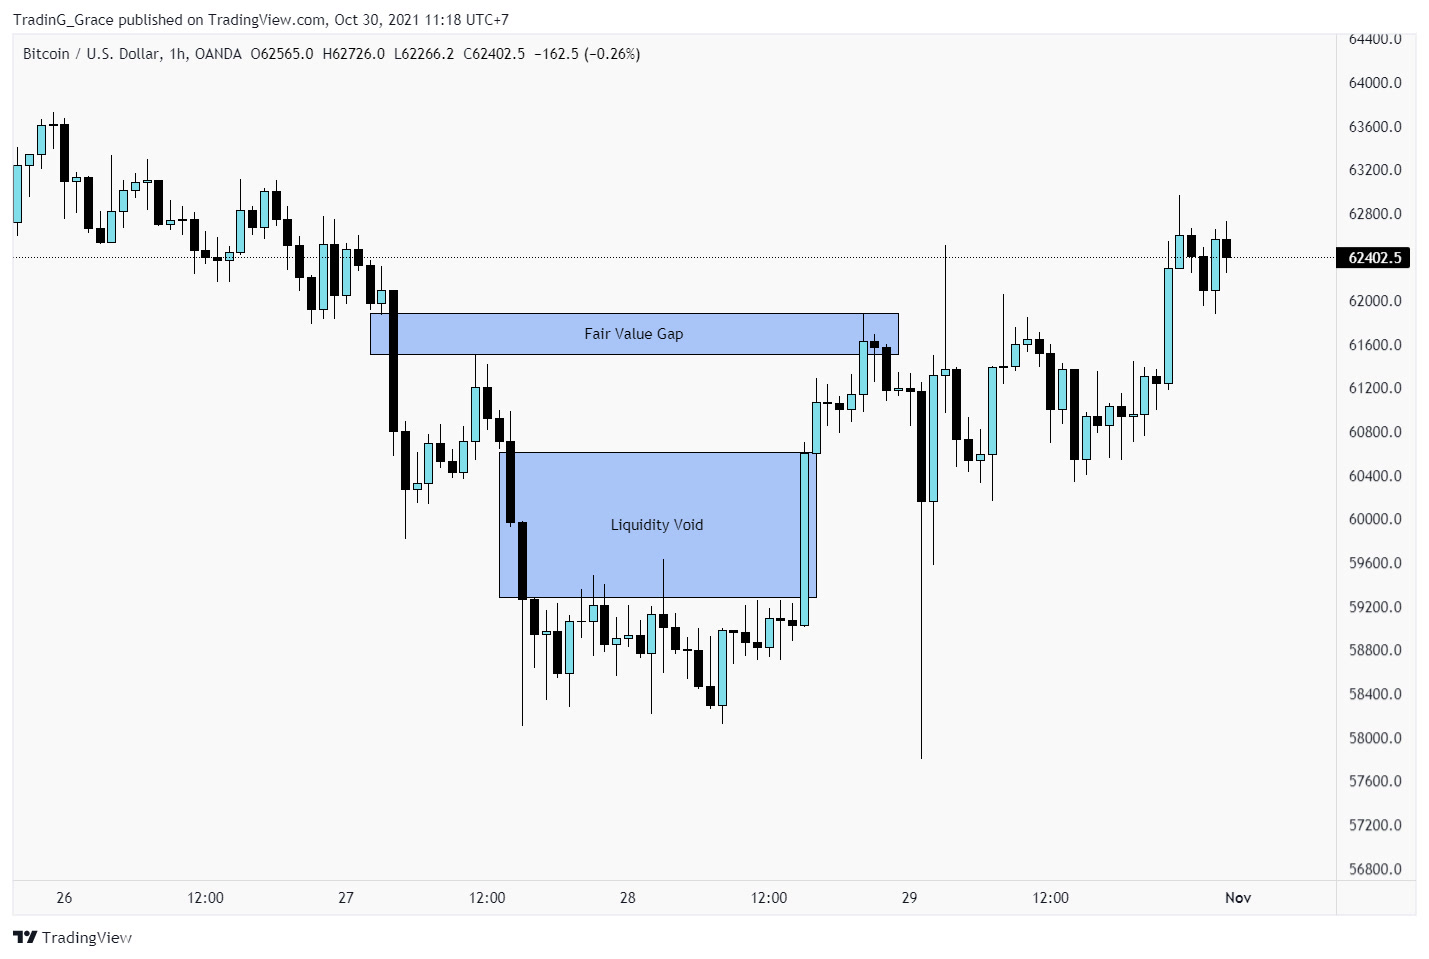
Before you trade a fair value gap strategy live with real risk, run this sequence:
Step one: Identify every FVG on your target pair and timeframe across 30 trading days using your broker's live chart, during market hours, in real time. Do not use replay. This is about developing live recognition speed without financial risk.
Step two: For each gap, document the time of formation relative to the session killzone. Flag it as killzone-confirmed or outside-killzone. After 30 days, compare the performance of each category.
Step three: Place limit orders on a demo account that uses live spreads, not ideal fill conditions. Record your intended entry versus your actual fill on every trade. Calculate your average fill deviation in pips. If your average FVG depth is 10 pips and your average fill deviation is 3 pips, you are entering 30 percent into the gap before the trade starts. That changes your stop placement logic.
Step four: Before any live entry, write a one-sentence invalidation statement. "This trade is wrong if price closes a 5-minute candle below [level]." This is the kill switch that prevents you from holding a position whose premise is already broken.
This is not a complex framework. But it is the difference between testing whether you can identify a fair value gap and testing whether you can actually trade one.
If you want to work through this kind of process with structure and accountability, the coaching plans here are built specifically around ICT application, not just concept delivery. The Lite tier at $150 per week is a good starting point if you have the identification side handled and you are trying to fix the execution layer. For a more detailed conversation about where you actually are, book a free discovery call and we can figure out whether coaching is even the right next step for you right now.
The backtest is not lying to you. It is telling you exactly what it knows. The problem is you have been asking it a question it was never designed to answer.
Harvest Wright
ICT Trading Coach · 10+ Years Experience
Harvest specializes in ICT methodology and has helped traders pass prop firm challenges, develop consistent strategies, and build the psychology needed for long-term profitability.
Book a Free Discovery Call →Take Your Trading to the Next Level
Get personalized 1-on-1 ICT coaching with Harvest Wright. Free discovery call, no commitment.
Book a Free Discovery CallFree ICT Funded-Trader Playbook
The setups, the pre-trade checklist, and the risk rules I use. Get it free.