Why Your Order Blocks Keep Getting Swept
If your order blocks keep getting swept before price reverses cleanly from just below where you marked them, the problem almost certainly has nothing to do with your broker, spreads, or market manipulation. It has to do with which candle you chose.
After 10+ years working through ICT concepts and genuinely grinding this stuff out in real market conditions, I can tell you that the candle selection problem is the single most consistent source of blown OB trades. And it is remarkably invisible to the trader experiencing it.
Key Takeaway: Most traders mark the reaction candle as an order block because it looks significant, but the actual origin of institutional imbalance is typically one or two candles earlier. By the time retail identifies and marks that candle, smart money has already fully delivered against it, turning what looks like a valid OB into a liquidity grab.
The Myth About Why Order Blocks Fail
Myth: Your order blocks get swept because of stop hunting, spread manipulation, or just bad luck.
Reality: Price sweeps your OB because you marked the wrong candle. Specifically, you marked the candle where price reacted rather than the candle where the imbalance originated.
What I Actually See: The trader who keeps getting stopped out on OB entries is almost always entering with confidence on the most visually obvious candle. Big bearish candle, strong displacement, textbook looking setup. But that candle is the delivery vehicle, not the origin. The order block, in ICT terms, is the last candle in the opposing direction before that impulse. It is the candle where institutional orders were placed and unfilled. Everything else is consequence.
Here is why this matters so specifically: smart money placed orders at the originating candle. When price returns, those orders are waiting there. The reversal happens from that candle, not from the large impulse candle retail is staring at. If you are marking the impulse candle, you are marking the exhaust, not the engine.
The Candle You're Marking vs. The Candle That Actually Matters
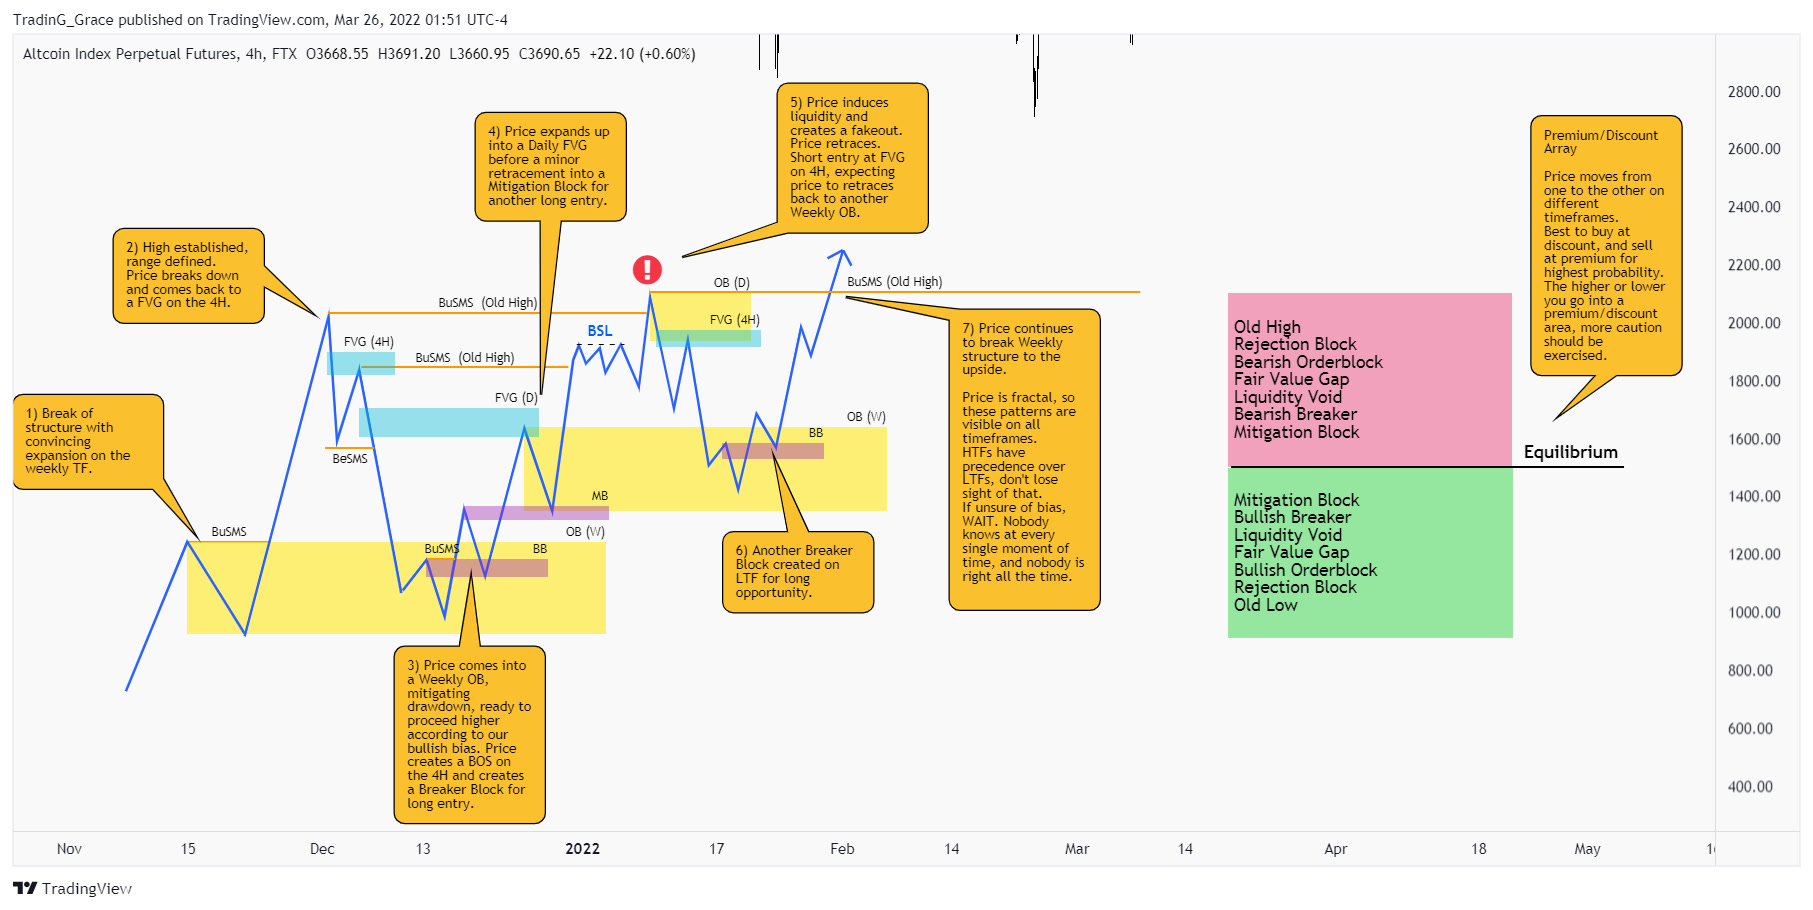
Let me be honest here. I used to get this wrong too. Not in a way I can pin to a specific trade or date, but in a pattern that cost me setups repeatedly before I actually traced the logic backward and understood what I was doing. The reaction candle feels important because it is visually dramatic. Big range, strong close, clear momentum. It looks like the story. But in ICT methodology, that candle is the last sentence. The order block is the title.
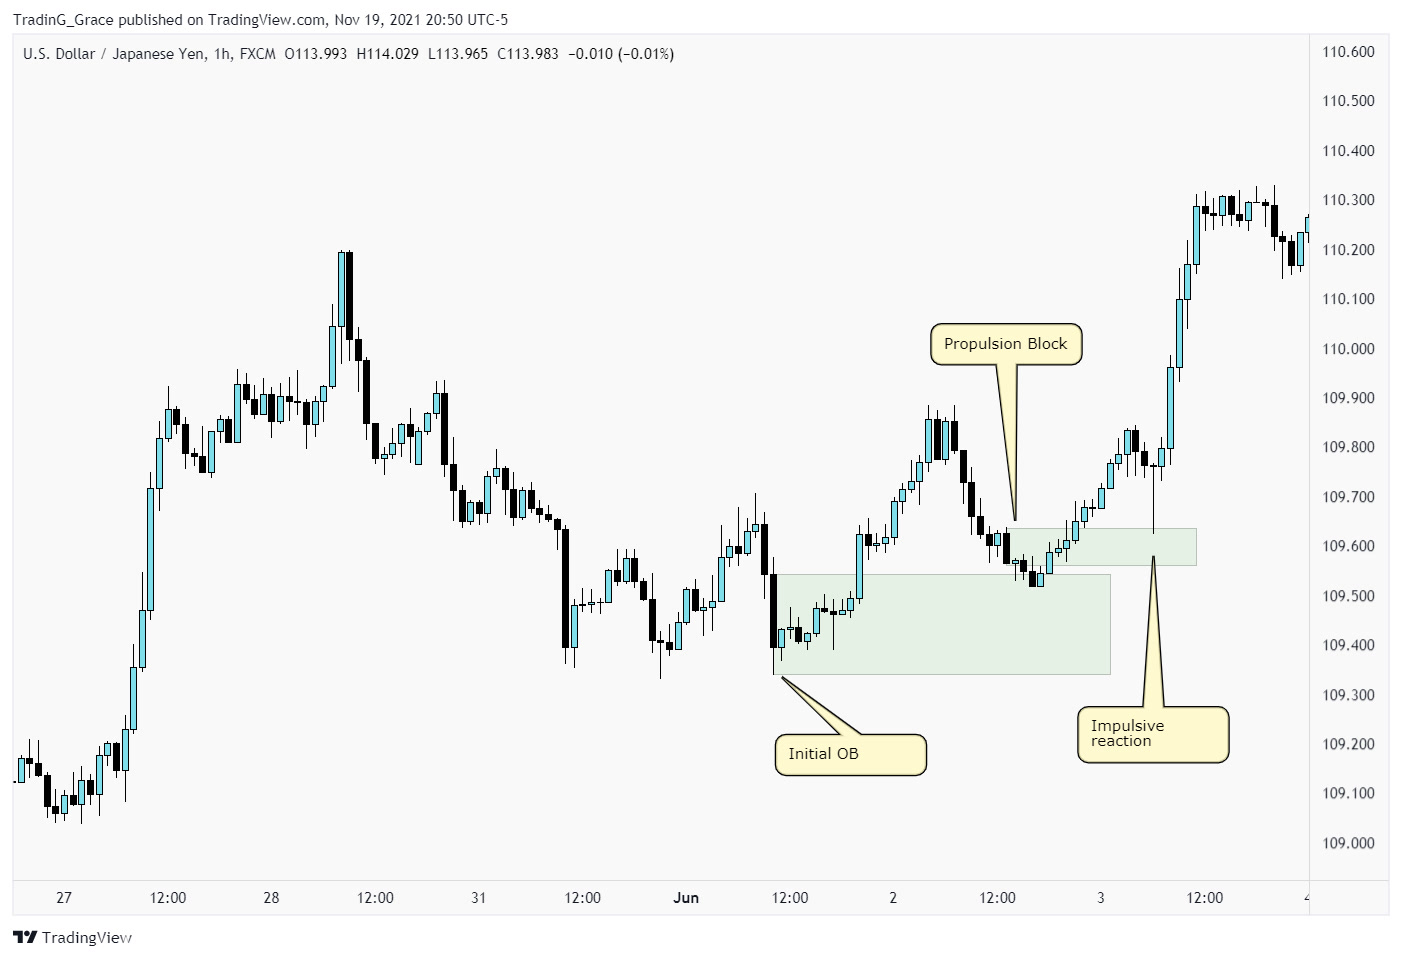
The actual OB logic, as ICT defines it, points to the last up-candle before a bearish displacement (for a bearish OB) or the last down-candle before a bullish displacement (for a bullish OB). That specific candle is where unfilled buy or sell orders from institutional participants sit waiting. When price comes back to that level, orders get fulfilled, and price reverses. The candle everyone marks, the big momentum candle, has no unfilled orders sitting in it. It was already delivered.
So when price returns to your marked zone and blows straight through it, it is not rejecting your analysis. It is completing the actual delivery to the real order block sitting one or two candles behind where you drew your box.
This compounds with a second problem: mitigation timing.
The Mitigation Problem Nobody Talks About
Even when a trader correctly identifies the originating candle, there is a second question that rarely gets asked: has this order block already been mitigated?
An order block gets mitigated when price returns to it and institutional orders at that level are fully filled. Once mitigated, it is no longer active. There are no unfilled orders left. But here is the trap. Retail traders frequently discover order blocks after the fact, when price has already made a significant move away from a level. They look left on the chart, spot what looks like a pristine OB, and treat it as a current trade opportunity. The problem is that price may have already visited that level once, quietly, without producing the dramatic reversal that would make it obvious on a casual glance.
This is especially common on lower timeframes where a quick wick or brief price excursion into an OB zone goes unnoticed because the trader was not watching that session. By the time the setup gets "spotted," there is nothing left to fuel the move.
Mitigation is not always dramatic. It does not always announce itself. This is precisely why passive OB marking, where you draw a zone and wait without checking whether price has visited it since formation, is unreliable.
For more on the gap between knowing ICT concepts and actually profiting from them, this piece on why knowing ICT concepts isn't making you money goes deeper into that specific failure mode.
A Worked Example: EURUSD at the London Open
Here is the kind of setup I mean. Picture EURUSD on the 15-minute chart during the London open. Price has been in a clear bearish draw, with a fair value gap sitting below the overnight consolidation zone. During the New York pre-market session, price makes a push to the upside, creating a series of bullish candles, then displaces sharply lower with a strong bearish impulse candle.
The instinct for most traders: mark that big bearish candle as the order block and wait for price to retrace into it.
The correct read: look at the candle immediately before that bearish impulse. If it was a relatively small bullish candle, that is your OB. The high of that candle forms the top of your zone. The open of that candle (or the low, depending on your specific OB model interpretation) forms the bottom. That candle is where sell orders were placed institutionally. That candle is where price will be drawn back to.
Entry would be a limit somewhere inside that originating candle's range, biased toward the upper portion since you are looking for price to tap in and reverse lower. Stop goes above the most recent swing high, above the liquidity that smart money would logically target if this OB were actually being invalidated, not just tested. Target sits at the fair value gap below, or the next significant draw on liquidity identified on the higher timeframe.
If you used the big bearish impulse candle as the OB, your limit entry would sit noticeably higher than the actual institutional level. Price returns, taps the real OB, reverses sharply, and you get stopped out just as the real move begins. Sound familiar?
For help calculating position sizing relative to that stop placement, the R2F risk calculator is worth bookmarking.
A Four-Step Diagnostic Framework
When you find what you think is an order block, run it through this sequence before placing an order.
Step 1: Identify the displacement first. Find the strong impulsive move. Do not start by looking for the OB. Start by confirming there was genuine displacement with a fair value gap or clear imbalance left behind.
Step 2: Go left from the displacement and find the last opposing candle. For a bearish displacement, find the last bullish candle immediately before the move began. That candle, specifically its open-to-close range, is your candidate order block. Mark that zone, not the impulse.
Step 3: Check for prior visits. Scroll through price action since that OB formed. Did price return to that zone at any point, even briefly? If a wick fully penetrated the zone and price closed back away from it, the OB may still be valid. If price traded through the zone and closed inside it without reversing, consider it mitigated.
Step 4: Confirm the draw on liquidity. A valid OB trade needs a reason for price to reverse. What is below it (for a bearish OB) that smart money would want to reach? An old low, a fair value gap, a dealing range low? If there is no clear target below, the OB context is weak regardless of how clean the formation looks. TradingView's multi-timeframe view is useful for checking this alignment quickly across timeframes.
This framework will not eliminate losing trades. What it will do is cut out the category of loss that comes from entering at completely the wrong candle, which in my experience is the most avoidable category of all.
The Contrarian Take Most ICT Traders Miss
Here is something most ICT content on YouTube will not tell you: the majority of order blocks you will ever identify are already spent by the time you find them. This is not pessimism. It is just the reality of how institutional order flow works.
Smart money does not wait for retail to catch up. Orders get placed, positions get built, and delivery happens on a schedule that has nothing to do with when you happened to open your charting platform. The OBs that actually work in real time are the ones you identified before price returned to them, not the ones you spotted mid-retracement.
This is the experience gap between someone with a year in ICT concepts and someone with a decade. The 10-year trader is not necessarily smarter. They have just watched enough OBs get swept that they stopped treating old levels as automatically valid and started building the habit of marking in real time, on live structure, before the return.
If you are still in the phase where you are discovering your setups after the fact, that is a normal part of the learning curve. The crash course is a good place to build the structural awareness that speeds this up.
For a related perspective on why concept knowledge alone rarely closes this gap, why knowing ICT concepts still isn't enough covers the other side of this problem.
One More Thing on Timeframe Alignment
The candle selection issue gets worse when timeframes are mixed carelessly. A 15-minute OB marked in isolation might be sitting directly inside a 4-hour premium zone, meaning the higher timeframe context is actively working against the lower timeframe entry. Retail traders do not check this enough. They find the OB, like the look of it, and enter. The result is a technically valid micro-structure trade placed directly against a macro-level delivery.
The question to ask is always: what is the higher timeframe trying to do, and does this OB sit in premium or discount relative to that range? An OB in premium on the 4-hour is a shorting opportunity. An OB in premium on the 15-minute inside a 4-hour premium zone is a trap. The candle still looks right. The context makes it wrong.
This is covered well in BabyPips' breakdown of multi-timeframe analysis for anyone wanting a foundational read on the concept outside of ICT-specific framing.
Where To Go From Here
If you are consistently getting swept on OB entries, start with the diagnostic framework above before changing anything else. Run your last five OB losses through the four steps and identify at which point the analysis broke down. My experience is that most traders find the answer at step two, which is where candle selection lives.
If you want more structured support working through this in real time across different pairs and sessions, take a look at the coaching plans and see which tier makes sense for where you are right now. The Lite plan at $150/week suits traders who have the concepts down but need accountability and feedback on markups. The Pro plan at $250/week goes deeper into live analysis and model refinement. Full Mentorship at $5,000 for four months is for traders who want to rebuild the entire process properly.
Or if you are not sure what you need yet, book a free discovery call and we can work that out together.
The swept OB problem is fixable. It just requires looking one candle further left than you have been.
Harvest Wright
ICT Trading Coach · 10+ Years Experience
Harvest specializes in ICT methodology and has helped traders pass prop firm challenges, develop consistent strategies, and build the psychology needed for long-term profitability.
Book a Free Discovery Call →Take Your Trading to the Next Level
Get personalized 1-on-1 ICT coaching with Harvest Wright. Free discovery call, no commitment.
Book a Free Discovery CallFree ICT Funded-Trader Playbook
The setups, the pre-trade checklist, and the risk rules I use. Get it free.