
The Silence Before the Trade: A GDP Prep Guide
There's a specific kind of silence that happens in the 48 hours before a major GDP release — and most traders fill it with the wrong noise. Chart zooming. Discord scrolling. Watching three different YouTube breakdowns of what might happen. By the time Thursday morning rolls around and price starts moving, they're not prepared. They're just informed. Those are two completely different things, and confusing them is what blows accounts on high-impact news weeks.
I've been using smart money concepts to navigate macro events like GDP releases for over a decade now. The framework that actually protects me isn't on a chart. It happens on the weekend before — in a deliberate, structured mental rehearsal that makes real-time emotional decisions nearly impossible. That's what this piece is about.
Key Takeaway: The most profitable move you make on GDP week is the trade you decided not to take on Saturday — and that decision requires a specific pre-commitment framework built before the week starts, not while price is spiking.
Why Smart Money Concepts Traders Are Especially Vulnerable to GDP Week
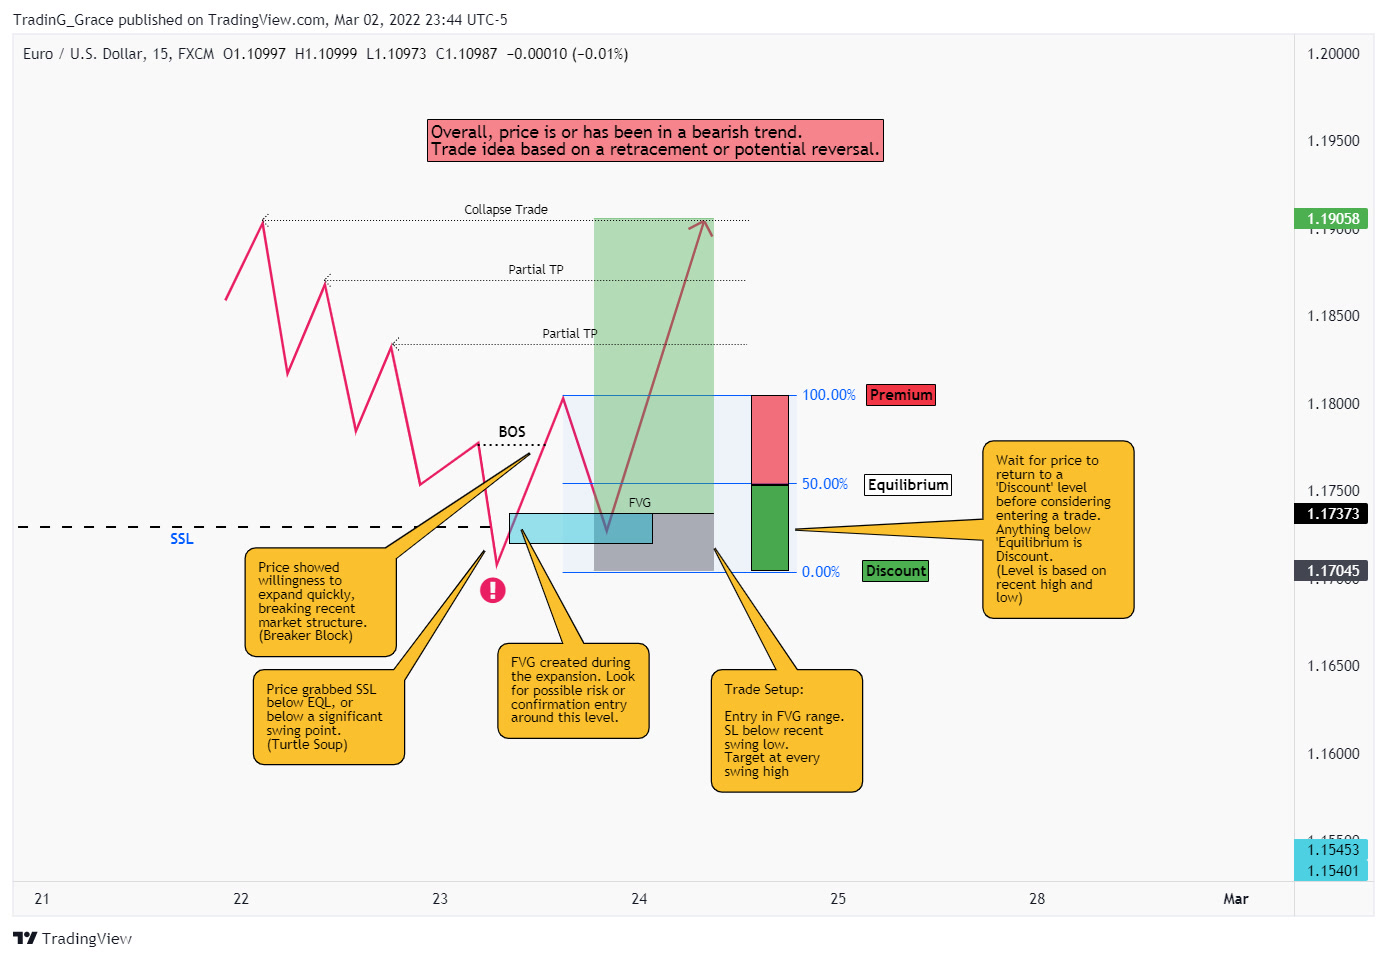
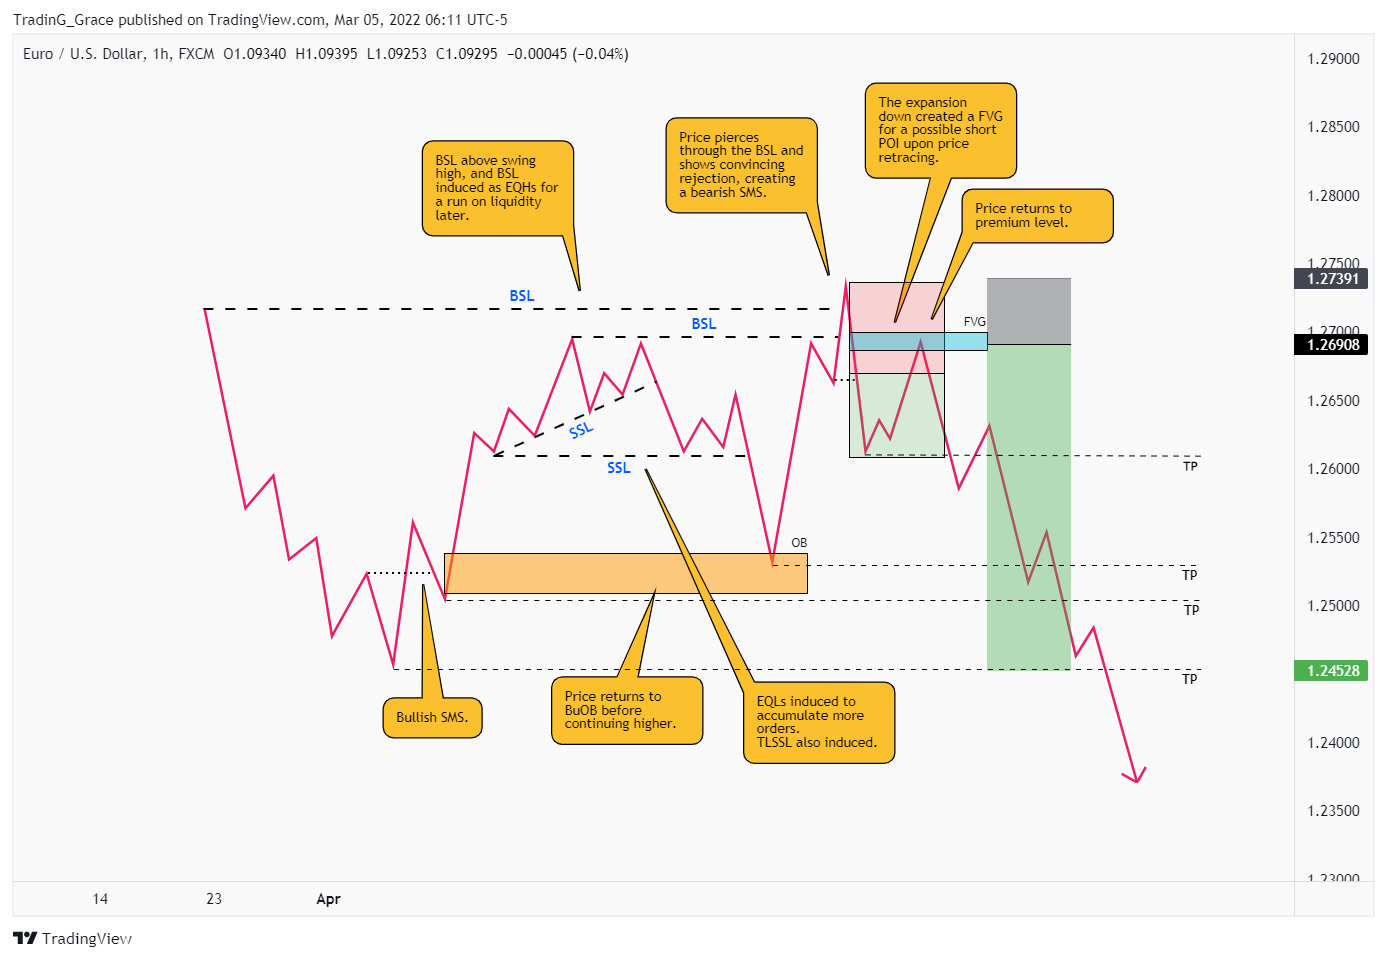
Here's the thing most ICT content doesn't address honestly: smart money concepts frameworks are precision frameworks. Order blocks, fair value gaps, displacement, liquidity grabs — these tools require clean, readable price delivery. GDP releases don't always give you that. Sometimes you get a straight aggressive push with no retracement. Sometimes you get a spike-and-reverse that sweeps liquidity in both directions before settling.
The ICT trader who's been winning in clean London or New York sessions — reading displacement beautifully, entering on FVGs with confidence — can get absolutely wrecked in the first 15 minutes after a GDP print, because the tools still look like they're working when they're not. A candle closes into what appears to be an order block. There's a partial fill. Then the market keeps going, through the OB, through the stop, through the logic.
I used to get this wrong too. Not because the concepts failed — but because I hadn't pre-defined what "valid" looked like under news-driven conditions versus standard sessions. I was applying Tuesday's ruleset to Thursday's chaos.
The fix isn't a different indicator. It's a different mental posture going into the week.
The Trader Who Trades GDP Like a Regular Session
Let me describe someone you've probably seen — or been. This trader is technically sharp. They understand premium and discount. They can identify a breaker block. They've done the work. But on GDP week, they treat Thursday morning like any other New York open.
They're sitting at the desk at 8:25 AM ET, charts open, watchlist ready, pre-marked levels from Sunday's analysis still on the screen. The number drops at 8:30. Price spikes 80 pips in six seconds. They see what looks like a mitigation of an order block on the 5-minute chart. They enter. The spread widens. Their stop gets tagged. Price reverses and runs 120 pips in the original direction.
This pattern is everywhere on GDP week. The trader has all the right tools but skipped the step that tells them when not to use them. Pre-commitment to a non-trading window — the first 5, 10, or 15 minutes after release depending on the pair and volatility profile — isn't timidity. It's an execution rule built during calm, rational thinking so that in-the-moment adrenaline can't override it.
That rule has to exist before Thursday. You cannot build it while you're watching a 15-pip spread on EURUSD at 8:31 AM.
The 48-Hour GDP Prep Framework (Step by Step)
This is the actual process I run every time a major GDP release falls during the trading week. For Q2 2026, with US GDP data and multiple central bank commentary cycles overlapping, this has become more important than ever — particularly given the Q2 market structure shifts we've been navigating this quarter.
Step 1 — Scenario Mapping on Saturday (Not Sunday)
Saturday, not Sunday. This matters. Sunday analysis has urgency — you're one day out. Saturday still feels removed, which means your thinking is calmer and less attached to a directional bias you've already started forming.
I pull up the weekly chart for the pairs I'm monitoring — usually EURUSD, GBPUSD, and sometimes DXY for context — and I map out three scenarios:
- Scenario A: GDP prints significantly above expectations. Where does price logically want to go? What liquidity pool is most obvious?
- Scenario B: GDP prints below expectations. Same questions.
- Scenario C: In-line print with a volatile but directionless reaction (this is more common than traders expect).
For each scenario, I write down — physically write, not type — the specific price levels where I'd consider a trade valid after the news. Not during. After.
Step 2 — Pre-Define Your Invalidation Levels
For every scenario, there's a level that tells me the narrative broke. I commit to these levels before the week starts. If EURUSD on a bullish GDP miss is targeting 1.0920 and my buy setup would form around 1.0845, my invalidation is a 4H close below 1.0810. That doesn't change on Thursday morning because I feel like it should still work.
Pre-committing to invalidation is what separates the disciplined application of smart money concepts from just pattern-matching under pressure. The setup either respects your pre-defined structure or it doesn't. If it doesn't, you're out — or you never entered.
Step 3 — Set Your Non-Trading Window
Decide before the week what your news blackout window is. Mine for GDP is typically 0-10 minutes post-release on EURUSD and 0-15 minutes on Cable, which tends to have sympathy volatility. During that window, I'm watching only. Charts open, hands off. The adrenaline you feel during that window is a biological signal, not a trading signal.
Step 4 — Mental Rehearsal on Wednesday Night
This sounds almost too simple to be useful. It isn't. Wednesday night, I close the charts, sit without screens, and mentally walk through each scenario I mapped on Saturday. I visualize price moving to Scenario A's target. I rehearse my emotional state — the FOMO if I missed the initial move, the temptation to chase. Then I rehearse staying out until my pre-defined entry window opens.
Doing this once builds almost nothing. Doing it every GDP week for two years builds a conditioned response that operates even when you're tired, distracted, or rattled by a different trade earlier in the session.
Step 5 — Post-Release Execution Protocol
Once the non-trading window closes, I'm looking for one thing: did price create a clean displacement + FVG structure that aligns with my pre-mapped scenario? Not "kinda aligns." Clean alignment. If it's there, I enter with the same sizing I use any other week — risk stays consistent, which I calculate using a position size calculator rather than eyeballing it in the heat of the moment.
If it's not clean, I don't manufacture a setup. Scenario C (no clear direction) happens regularly, and the correct trade on those days is zero trades.
A Real Example: EURUSD on GDP Week, April 2026
Here's how this actually played out for me recently. Going into the US GDP release this month, I had pre-mapped a bearish scenario where a weak print would drive DXY lower and push EURUSD toward the 1.0960 weekly liquidity pool above old highs.
When the number dropped and came in soft, price spiked up aggressively — exactly the Scenario B reaction I'd mapped. I sat through my 10-minute blackout window. At roughly the 12-minute mark post-release, EURUSD pulled back and formed a clean FVG on the 5-minute chart between 1.0892 and 1.0904, with a clear OB just below at 1.0886. The displacement into the FVG was strong — no overlap, clean gap.
I entered long at 1.0898, stop at 1.0874 (24 pips below structure, not just below the FVG), risking 0.75% of the account. My pre-mapped target was the 1.0958 area. Price reached 1.0944 before stalling — I took partial profits at 1.0940 (roughly 1.75R) and moved stop to breakeven. The trade eventually stopped out at breakeven on the remaining portion as London closed.
Total outcome: +1.1R on the position after partials. Not spectacular. But clean. And completely detached from the emotional chaos of the initial spike — because I wasn't in the market for those 12 minutes. The preparation on Saturday made Thursday a process execution, not a reaction.
For more on how FVG entries hold up under volatile conditions like this, the ICT Fair Value Gap trading checklist goes deep on the specific pre-trade confirmations I use.
What This Framework Protects Against (That Charts Can't)
The economic calendar tells you when GDP releases. CME Group's FedWatch tool tells you market expectations. Neither of those things tells you how to manage the version of yourself that exists at 8:32 AM Thursday, watching unrealized losses or missed gains flash across the screen.
Every account protection article talks about stop losses. Position sizing. Max drawdown rules. Those are mechanical guardrails — necessary, but downstream of the moment when a trader decides to move their stop, size up out of frustration, or enter a setup that doesn't really exist. That decision happens in the psychology layer, not the execution layer.
The 48-hour prep framework addresses the psychology layer directly. It's why seasoned ICT traders talk about "doing nothing" as a skill — not a passive state, but an active pre-committed decision that was made before the chaos started.
If you've been struggling with news week consistency, the issue probably isn't your setup identification. It's the absence of a pre-commitment structure that holds when your emotional state doesn't. And that's particularly relevant right now given the overlapping volatility events this quarter — as I covered in the April NFP liquidity patterns piece, each high-impact event in 2026 is compounding the emotional pressure on retail traders who are reacting rather than preparing.
Building This Into Your Practice
The Saturday scenario mapping session takes about 45 minutes when you're new to it. After a few months of doing it consistently, it compresses to 20-25 minutes because your scenario identification gets faster and your written commitments get more precise.
Start with a single pair. Map three scenarios. Write the invalidation level for each. Set your non-trading window for the release. Do the Wednesday visualization. Then execute only what you pre-planned.
If this is new territory for you and you want a more structured approach to building this into your trading routine, the coaching plans at R2F walk through this kind of psychological framework alongside the technical ICT curriculum — because one without the other consistently underperforms.
The silence before the trade isn't empty. It's where the actual edge gets built.
Harvest Wright
ICT Trading Coach · 10+ Years Experience
Harvest specializes in ICT methodology and has helped traders pass prop firm challenges, develop consistent strategies, and build the psychology needed for long-term profitability.
Book a Free Discovery Call →Master Your Trading Psychology
Psychology is 80% of trading. Our coaching includes dedicated psychological coaching sessions.
See Coaching PlansFree ICT Trading Checklist
The exact checklist I use before every trade. Get it free.