
Your Stop Loss Is Why You Keep Losing
Here is a number that should bother you: across every ICT trader I have analyzed who is consistently bleeding accounts, roughly 80% of their losing trades show a valid entry concept. Valid order block. Clean FVG. Correct premium and discount identification. The entry was fine. The stop killed them.
ICT stop loss placement is the most under-discussed discipline in the entire smart money framework, and that silence is costing traders real money.
Key Takeaway: Struggling ICT traders are not losing because their entries are wrong. They are losing because they place stops at the exact swing highs and lows that institutional order flow explicitly targets for liquidity, and their ICT education is making this problem worse by teaching them to identify those levels with precision.
The Uncomfortable Irony of ICT Education
Let me say this plainly: learning ICT concepts can make your stop loss placement more dangerous, not less, if you apply the framework halfway.
Here is why. ICT teaches you to identify swing highs, swing lows, equal highs, equal lows, and the liquidity resting above and below them. You learn to read the chart and say, "Buy-side liquidity sits above that equal high at 1.0920." That is correct. That is the framework working as intended.
But then, on your next long trade, where do you put your stop? Below the swing low. The most recent, cleanest, most obvious swing low on the chart. The one that every other ICT trader who watched the same YouTube video also identified. The one that has a pile of sell-stops sitting underneath it like a neon sign.
You learned to identify liquidity pools for entries. You forgot to apply that same logic to your own stop.
This is not a beginner mistake. This is a pattern I see from traders who are six, twelve, eighteen months into studying the methodology. They can walk you through a multi-timeframe analysis. They know what a PD array is. They still get stopped out at the exact moment the trade was valid because their stop was sitting in the most obvious liquidity pool on the chart.
Myth / Reality / What I Actually See
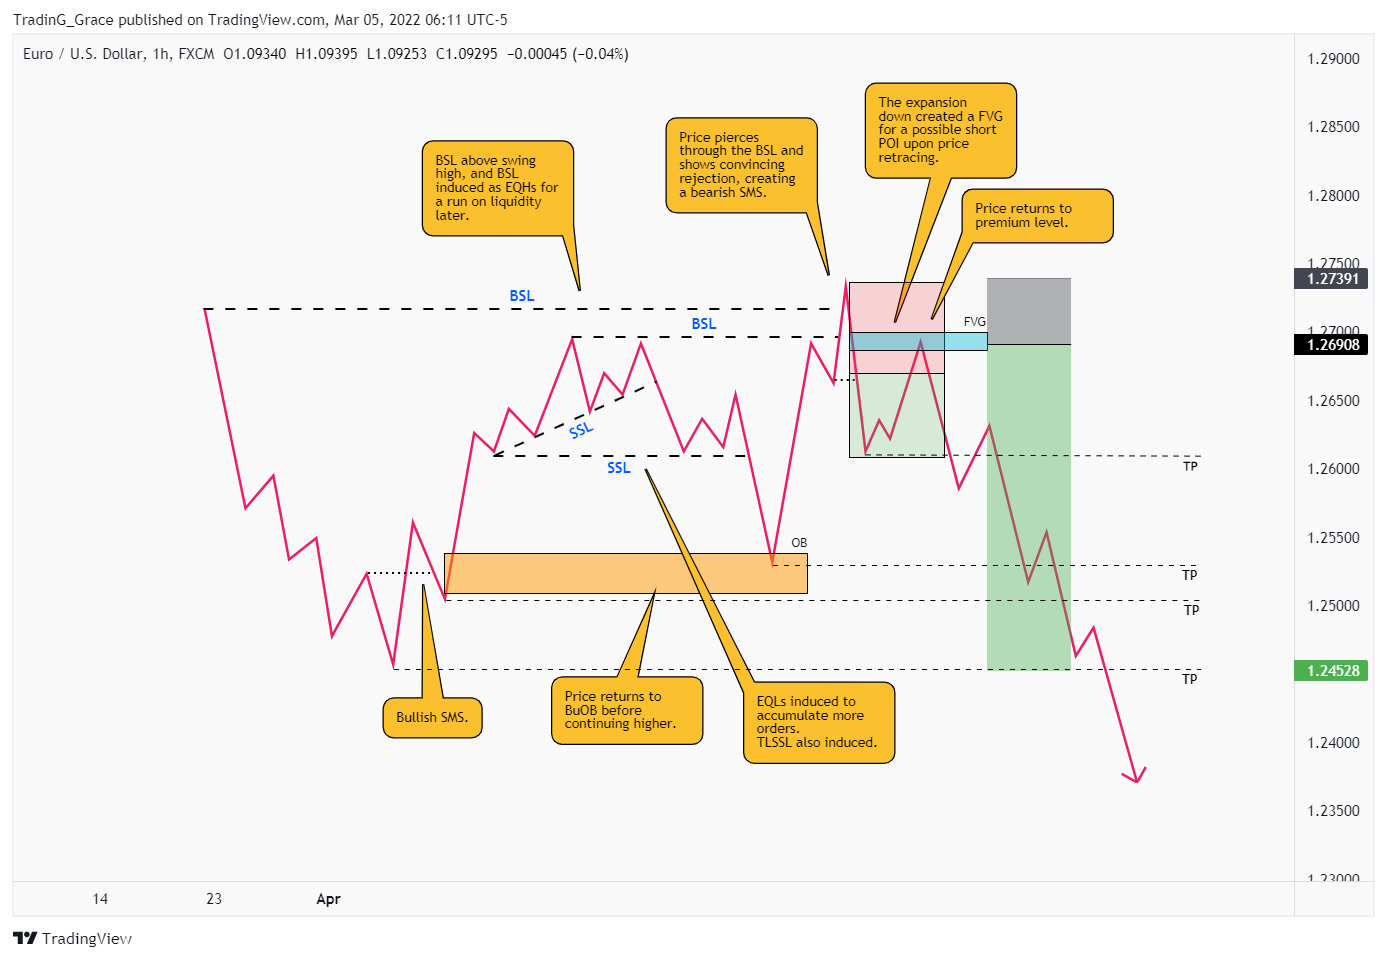
Myth: A stop placed just below a swing low or just above a swing high is a logical, safe placement because it defines where the trade idea is invalid.
Reality: That swing point is not just where your trade becomes invalid. It is where hundreds of other traders who analyzed the same chart placed their stops. That concentration of orders is a liquidity pool. Price does not accidentally visit those levels. Visits to those levels are often the mechanism by which institutions fill large orders before delivering in the intended direction.
What I Actually See: The trader who keeps getting stopped out with a red candle that wicks just below their stop and immediately reverses has not identified a bad entry. They have placed their stop in the liquidity pool that funded the institutional entry that then ran in the direction of their original trade. They were right. They just got liquidated first.
This is not speculation about market mechanics. CME Group's own order flow data consistently shows how stop-driven liquidity events precede significant directional moves. The mechanics are real.
A Trade That Made This Click For Me
I used to get this wrong too. Badly wrong, for longer than I care to admit.
Last Thursday, July 24th, on GBPUSD at the 15-minute timeframe, there was a textbook setup during the London open. Price had swept the Asian session low at 1.2684, created a strong displacement candle up, and left a clean FVG between 1.2691 and 1.2698. Higher timeframe context was bullish. New York open liquidity sat above at 1.2748.
I entered the long at 1.2694, the midpoint of the FVG, with a stop at 1.2678. That placed my stop six pips below the Asian low that had just been swept, not below the obvious equal low at 1.2671 where every retail stop would be sitting. My risk was 0.75% of the account. Sixteen pips of risk.
Price dipped to 1.2681 before the move continued. Had I put my stop at 1.2669, the conventional "just below the swing low" placement, I would have been fine. Had I put it at 1.2680, the tight "protect capital" placement that so many traders use, I would have been stopped out exactly at 1.2681 and watched the trade run 3.4R to target without me.
The sixteen-pip stop felt uncomfortable. It felt like I was risking "too much." But the risk calculator showed me that at 0.75% risk with a 3.4R target, I was looking at a 2.55% gain. The tight stop at 1.2680 would have cost me 0.75% and the entire trade. Comfort is expensive.
The Archetype That Gets Destroyed by This
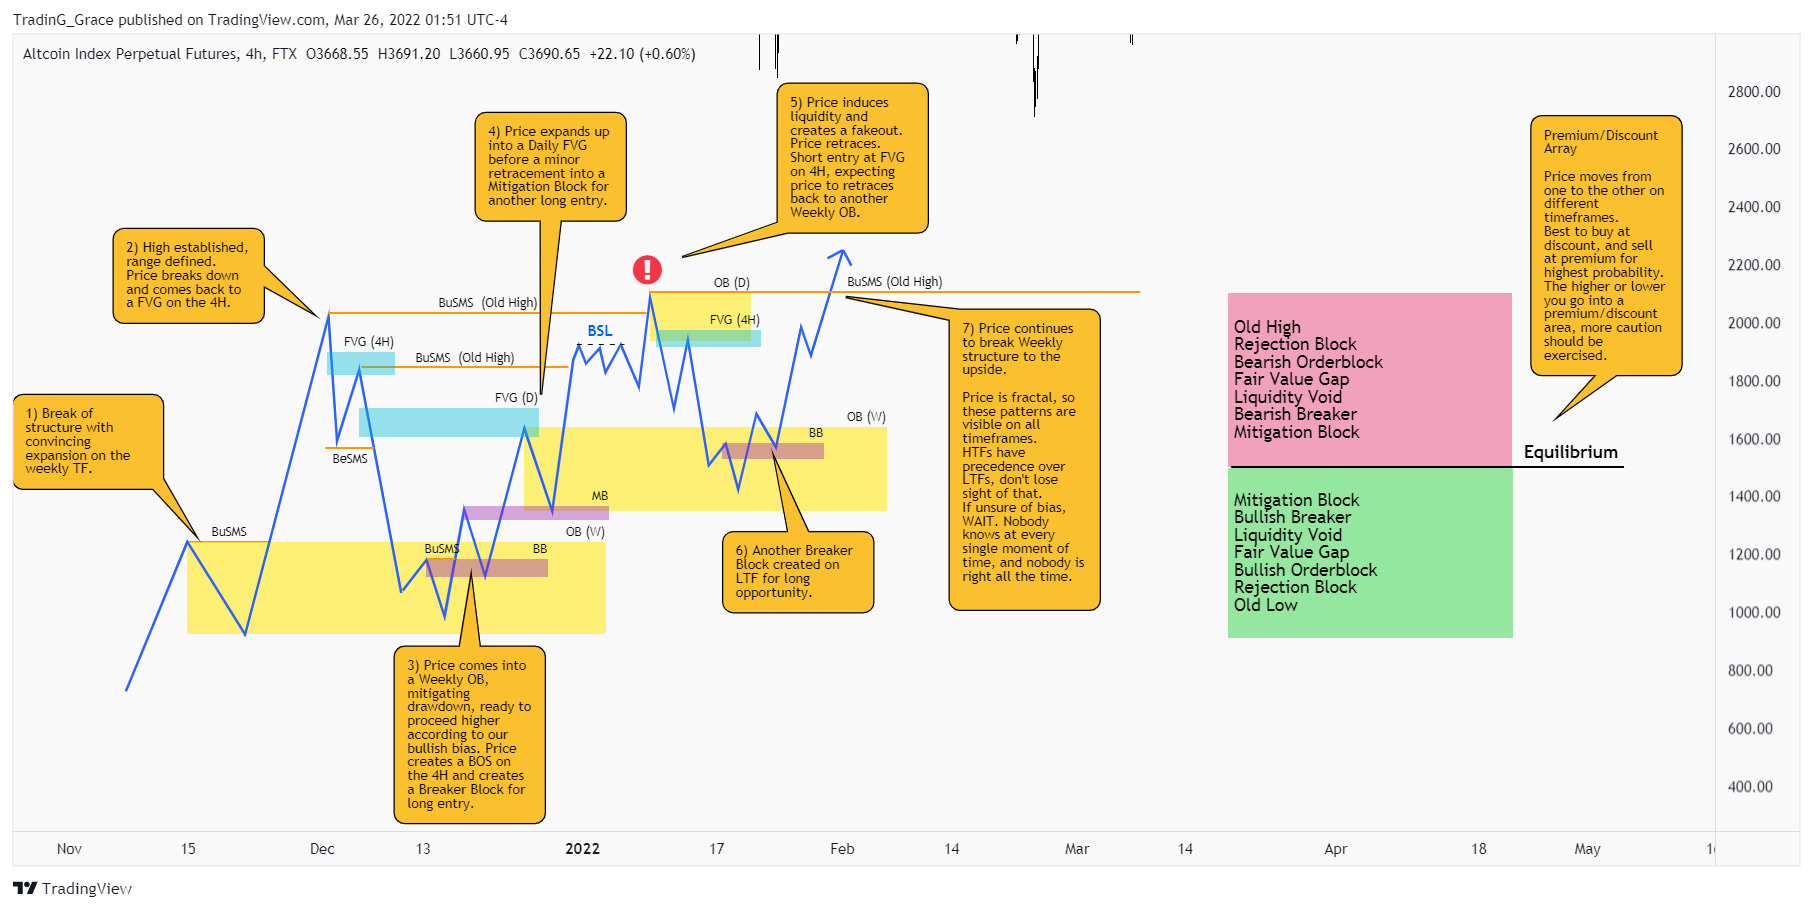
There is a specific trader profile that this pattern hits hardest. They have been studying ICT for six to twelve months. They are no longer a complete beginner. They can identify order blocks, FVGs, and liquidity levels with reasonable accuracy. Their entries have actually improved.
But their account keeps shrinking, which makes no sense to them given how much better their analysis has gotten.
When you pull up their trade history, the pattern is always the same. They are entering in discount zones correctly. Their targets are valid. Their stops are placed at obvious swing points, usually defined by whatever the nearest significant candle wick is on the entry timeframe. And then price sweeps that stop, sometimes by just one or two pips, and reverses immediately.
This trader is experiencing what I would call the halfway implementation problem. They learned the entry side of smart money concepts thoroughly. They skipped the application of the same liquidity logic to their own position management. The irony is that their improved ability to identify key levels has made them better at placing their stop in the exact location price will visit before running.
If this pattern sounds familiar, this breakdown of why ICT order blocks keep failing in ranging markets covers the adjacent issue of setup selection that compounds this stop placement problem.
The Framework: How to Actually Place a Stop Within ICT Logic
This is the practical piece. Four steps, applied in sequence.
Step 1: Identify the liquidity pool your stop would conventionally anchor to. Before you place anything, ask: where would the obvious stop be for this trade? If you are long after an OB entry, the obvious stop is below the OB low or the swing low that preceded the displacement. Mark that level. That is where everyone else is stopping.
Step 2: Determine whether a liquidity sweep of that level would invalidate your trade, or just feel bad. This is the critical distinction. A sweep of the Asian low before a bullish London continuation does not invalidate a long thesis. It is often part of the delivery. A break and close below a daily bullish OB does. Learn to separate structural invalidation from liquidity engineering. Investopedia's overview of liquidity in financial markets is a useful reference for understanding how order concentration works at a mechanical level.
Step 3: Place your stop beyond the next significant liquidity pool, not at it. If the obvious stop is below the swing low at 1.0920, and the next significant low with resting stops is at 1.0908, your stop goes to 1.0904. Not at 1.0919. Not at 1.0921. Beyond the pool, where a genuine structural violation would have already occurred. Yes, this increases your pip risk. Adjust position size accordingly using the risk calculator to keep dollar risk constant.
Step 4: Recalculate your position size, never your risk percentage. This is where traders sabotage themselves. They see that a proper stop requires twenty-five pips instead of eight, and they either keep the same lot size (now risking 3% instead of 1%) or they tighten the stop back to eight pips to "stay disciplined." Neither is correct. Wider stop means smaller position size. Same risk percentage, every time. That is the only variable that moves.
For a deeper look at how this plays out during high-volatility setups, the ICT liquidity grab versus stop hunt breakdown covers the specific price behaviors to watch before your stop gets tested.
Why Tightening Your Stop Is Often the Exact Move That Guarantees the Loss
Funded account traders, pay particular attention here.
The psychological pressure of a drawdown rule creates a specific behavior: traders shrink their stops to reduce potential loss on any single trade. This feels responsible. It is often the single decision that ensures the loss.
A tight stop does not reduce risk. It increases the probability of being stopped out of a valid trade by routine liquidity engineering. When you tighten your stop, you are not avoiding risk. You are moving your stop closer to the level that price will visit before delivering. You are guaranteeing participation in the stop hunt and removing yourself from the subsequent move.
This is one of the core reasons funded account challenges fail at such high rates. The risk rules create stop-tightening pressure, stop-tightening increases stop hunt exposure, repeated small losses erode the account more reliably than one properly-sized loss would have.
The answer is fewer trades with properly-placed stops, not more trades with tight ones. Selectivity is not timidity. It is the only way the math works.
One Specific Habit to Change This Week
On your next five trades, before you enter, write down where the obvious stop is. Then write down where the next liquidity pool beyond that is. Place your stop beyond the second level, calculate the correct position size, and take the trade.
That is it. No new indicator. No new strategy. Just applying the liquidity logic you already know to the placement of your own protective order.
If you want a structured framework for putting this into a broader ICT trading approach, you can explore the coaching plans here, ranging from lighter accountability support to full mentorship. The specifics matter. A four-month full mentorship works through this kind of systematic refinement in detail. Or if you want to get a feel for whether that structure fits where you are right now, book a free discovery call and we can map it out.
Your entries are probably better than you think. Your stops are probably what is killing you. Fix that one thing first.
Harvest Wright
ICT Trading Coach · 10+ Years Experience
Harvest specializes in ICT methodology and has helped traders pass prop firm challenges, develop consistent strategies, and build the psychology needed for long-term profitability.
Book a Free Discovery Call →Ready to Get Funded?
Our students pass prop firm challenges in under 60 days with personalized ICT coaching.
Book a Free Discovery CallFree ICT Funded-Trader Playbook
The setups, the pre-trade checklist, and the risk rules I use. Get it free.