
GDP Day Trading: What Smart Money Does First
Every GDP release, the same thing happens. Traders glue themselves to their screens at 8:30 AM Eastern, finger hovering over the buy or sell button, waiting for the number. The candle explodes. They chase. They get stopped out. And somewhere on the other side of that trade, a desk that positioned six hours ago just closed with a clean 3R.
That's not an exaggeration. That's a pattern I've watched repeat itself across dozens of GDP cycles over more than a decade of live trading — and understanding why it happens comes down to one thing: smart money concepts don't pause for economic data. They weaponize it.
Key Takeaway: GDP is not a 'trade the spike' event. Institutional positioning locks in during the 6-hour pre-release window while retail traders are primed by narrative bias to misread the move. The number is the exit, not the entry.
Myth: GDP Is a Fundamental Catalyst. Reality: It's a Liquidity Event.
Myth: The GDP print moves the market because it tells institutions something they didn't know.
Reality: By the time the Bureau of Economic Analysis releases the advance estimate, major desks have already built their positions using leading data — ISM manufacturing, retail sales, jobless claims, the Atlanta Fed GDPNow tracker. They're not surprised. They're distributing.
What I Actually See: Retail traders treat GDP like an oracle. They wait for the number, form an opinion in 0.3 seconds, then execute with maximum emotional urgency. That urgency is the product, not the participant. The spike retail chases is the exit liquidity smart money needed to close positions they built before sunrise.
This isn't cynicism. This is mechanics. Large institutional orders can't be filled in one candle on a news spike — they need a sustained order flow environment. The pre-release accumulation phase is where that happens quietly, in the hours when retail volume is thin and most traders haven't had their coffee yet.
If you want to understand how this dynamic plays out across different macro events, my breakdown of April NfP week liquidity patterns covers the structural fingerprints in granular detail.
The 6-Hour Window Nobody Talks About
Here's what actually matters on GDP day, and almost nobody in the YouTube ICT community covers it: the 6-hour pre-release window, roughly 2:30 AM to 8:30 AM Eastern.
During this window, three things happen with unusual regularity:
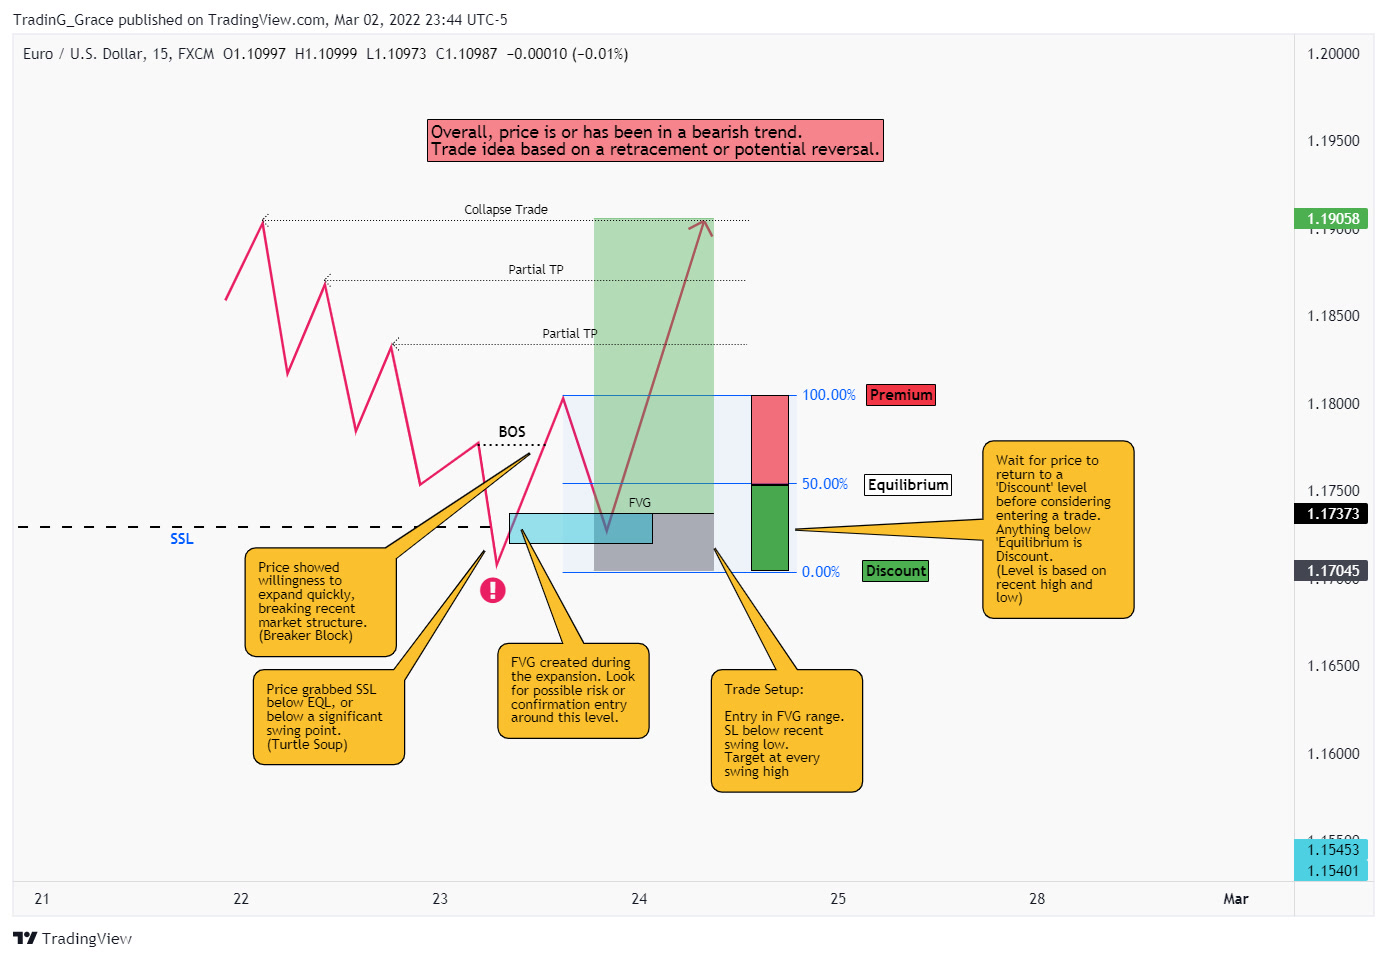
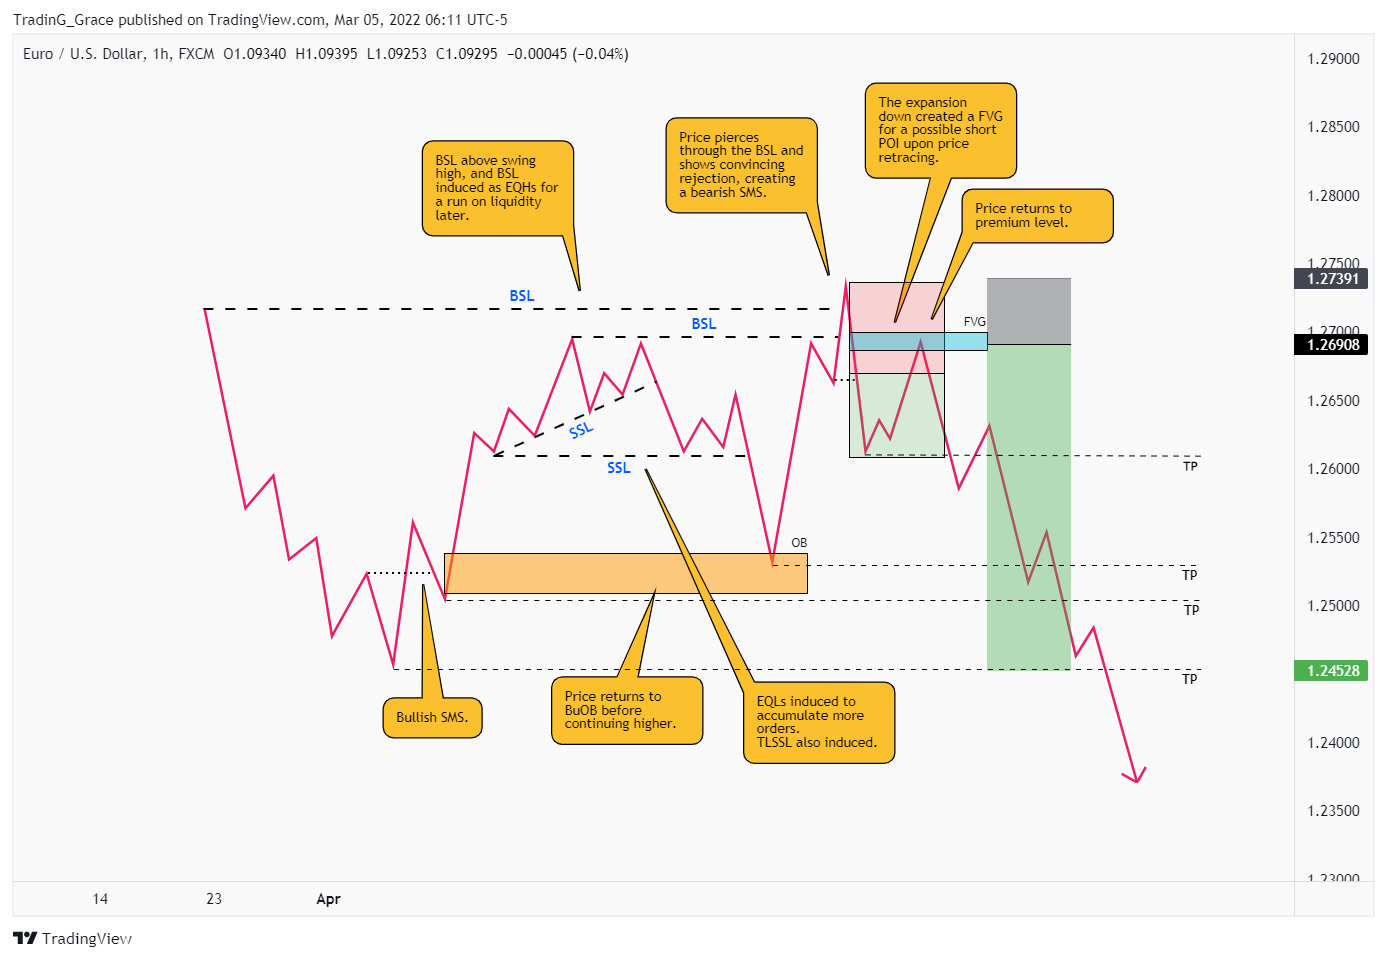
1. Asian session creates a range. This range isn't random consolidation. It's accumulation. Look at your 15-minute chart — you'll often see a classic turtle soup setup, where price sweeps above or below the Asian high/low, generates a false breakout, then reverses sharply back into the range. That sweep collects retail stops and fills institutional orders in one movement.
2. London session displaces. Between 3:00 AM and 6:00 AM Eastern, price typically makes an aggressive displacement away from the Asian range — sometimes as much as 30-50 pips on majors. Most retail traders who are awake interpret this as "the market is moving, I should get in." Wrong. That displacement is positioning, not direction. London often reverses to fill the Fair Value Gap it created before New York opens.
3. The FVG sits there like a loaded spring. When New York opens at 8:00 AM and price pulls back toward that London displacement FVG, that is your institutional fingerprint. That's where smart money defended its position before the data dropped.
I used to get this wrong too — badly. Early in my career I'd see the London displacement and think I missed the move. I'd wait for GDP, then chase the initial reaction like everyone else. It took years of reviewing trade logs and correlating them with pre-release structure before I understood: the FVG left by London displacement on GDP morning is one of the highest-probability entries in the macro trading calendar.
A Real Trade: EURUSD, May 2026 GDP Release
Let me make this concrete because abstract explanations don't help you in the moment.
On the morning of the Q1 2026 advance GDP release, I was watching EURUSD on the 15-minute chart. Asian session had built a clean range between 1.0812 and 1.0849. At approximately 3:15 AM Eastern, London opened with a sharp displacement to the downside — price pushed to 1.0791, sweeping the Asian low by 21 pips and collecting a significant cluster of buy stops that had built up below a prior week low.
That displacement left a clean FVG on the 15-minute chart between 1.0804 and 1.0817.
At 7:48 AM Eastern — 42 minutes before GDP dropped — price retraced into that FVG and printed a bullish displacement candle off the 1.0806 level. No news. No catalyst. Just institutional defense of a pre-positioned long.
I entered at 1.0809. Stop at 1.0791, 18 pips of risk, 0.75% of account. The trade was already at 1.4R by the time GDP hit at 8:30 AM. The print came in below expectations — the kind of "bad" number that should've tanked price. Instead, EURUSD dipped briefly to 1.0813, then launched to 1.0871 over the next 90 minutes.
I took partials at 1.0851 (2.3R) and let the remainder run to 1.0869 (3.3R) before the 4-hour inefficiency above acted as resistance.
Total risk: 0.75%. Total gain: approximately 2.1% blended across the partials. The "bad" GDP number didn't matter. The position was already in profit before the spike ever happened, because the entry was based on structure, not speculation.
Use a proper risk calculator before sizing into macro events — the volatility expansion post-release can turn a properly sized trade into a margin event if you're not precise going in.
The 'Sell in May' Trap: How Narrative Bias Poisons ICT Traders
Here's the psychological layer that makes this particular GDP cycle especially dangerous.
We're in May 2026. The "Sell in May and go away" narrative is everywhere — financial media, trading forums, social posts. It's a seasonal bias that primes retail traders to interpret any bearish data as confirmation of a trend they've already emotionally committed to.
When GDP comes in below expectations during May, traders who've absorbed the seasonal narrative experience something closer to relief than analysis. See? I knew it was going to drop. The data confirms the trend. That cognitive shortcut bypasses everything the ICT framework actually teaches about premium/discount, institutional order flow, and displacement.
The archetype I see constantly: the trader who has genuinely studied smart money concepts, can draw order blocks correctly, understands FVGs, has read the model inside and out — and then completely abandons all of it the moment a macro number drops that aligns with their existing bias. They chase a 40-pip move that's already 80% complete. They enter in premium because "the momentum is strong." They get stopped out on the retracement that was statistically inevitable, and they blame the GDP release instead of the decision to override their own framework.
The framework didn't fail. The narrative hijacked the execution.
This is worth understanding in the broader context of why Q2 2026 market structure shifts are breaking traditional ICT setups — seasonal narratives and macro volatility interact in ways that make psychological discipline more important than ever right now.
The Pre-GDP Framework: Exactly How I Approach It
Here's the step-by-step process, not the theory:
Step 1 — Map the Asian range the night before. I literally draw horizontal lines on my 15M chart at the Asian high and low before I go to sleep. GDP days are known in advance. Prepare the chart, not the reaction.
Step 2 — Watch London displacement (3:00–6:00 AM Eastern). Is London sweeping the Asian high or low? Which direction? That displacement against the seasonal/macro narrative is more significant than one that confirms it. Note the displacement, find the FVG it creates.
Step 3 — Mark the FVG levels. Specifically the 50% equilibrium of the FVG. This is where institutional defense tends to appear on the retracement.
Step 4 — Wait for price to return to FVG before 8:00 AM. If price never returns and runs away from the displacement, there's no trade. Missing a trade is not a loss. Forcing an entry because you prepped is.
Step 5 — Entry confirmation. A bullish or bearish displacement candle off the FVG, with a clear break of structure on the 5-minute chart. Not a slow grind — an actual displacement.
Step 6 — Size conservatively. GDP releases carry expansion risk. I reduce my standard risk by 25-30% on these days — not because I'm afraid, but because the range expansion post-release can briefly spike through logical stop zones before reversing. That's a different conversation than the trade being wrong.
Step 7 — Take partials before the release. If the trade is already 1.5R+ at 8:25 AM, I take at least 50% off. Let the remainder ride the post-release expansion if it aligns. Never let a winner become a full-risk trade into a news event.
For a deeper look at how FVG entries are confirmed in volatile conditions, the ICT Fair Value Gap Trading Checklist is worth going through before your next macro day — 9 specific pre-trade checks that catch the traps most traders miss.
What This Actually Means for Your Trading
GDP isn't unpredictable. The post-release spike isn't where the money is made by the people consistently making money. The edge is in recognizing that economic data releases are mechanical events within a framework that was already operating hours before the number dropped.
Smart money concepts exist precisely to help retail traders stop playing the game at the table where the deck is stacked — and start reading the fingerprints of where real positioning happened. The 6-hour pre-release window leaves those fingerprints everywhere. The FVG from London displacement. The Asian range sweep. The quiet defense of an order block at 7:50 AM that nobody on financial TV mentions.
If you want to go deeper on building a complete framework around this — not just GDP but the full macro calendar within an ICT context — the coaching plans at R2F Trading are built specifically for traders who already understand the concepts but keep losing consistency in execution. Lite starts at $150/week, Pro at $200/week, and the Full Mentorship runs $1,000 for 4 months.
Or if you're not sure where you are in the process yet, book a free discovery call and we'll figure it out together.
The number is never the trade. The positioning before the number — that's where the actual story is written.
Harvest Wright
ICT Trading Coach · 10+ Years Experience
Harvest specializes in ICT methodology and has helped traders pass prop firm challenges, develop consistent strategies, and build the psychology needed for long-term profitability.
Book a Free Discovery Call →Master Your Trading Psychology
Psychology is 80% of trading. Our coaching includes dedicated psychological coaching sessions.
See Coaching PlansFree ICT Trading Checklist
The exact checklist I use before every trade. Get it free.