
Why Watching More Charts Makes You Worse
Here is a pattern I have watched repeat itself for over a decade: a trader hits a wall, starts losing with setups that used to work, and their immediate response is to log more hours in front of the charts. More charts, more timeframes, more sessions monitored. The logic feels airtight. More exposure equals more skill, right? That is how it works in most disciplines. In trading, and specifically in ICT trading consistency, it almost always makes things measurably worse.
Key Takeaway: Unstructured screen time does not build ICT trading consistency, it trains your subconscious to manufacture confluence where none exists. The fix is not fewer hours necessarily, but a completely different relationship with what those hours are for.
The Myth That Screen Time Is Practice
Myth: Logging more hours in front of charts builds pattern recognition and will eventually click into consistency.
Reality: Pattern recognition is only as good as the signal-to-noise ratio of the data you feed it. Stare at a random number generator long enough and your brain will find patterns in it. That is not a metaphor. It is a documented cognitive phenomenon called apophenia, and the market is the single most hostile environment on earth for it.
What I Actually See: Traders who have logged 10, 12, 14 hours a day for months arrive at the same broken place. They do not lack ICT knowledge. They can recite order block rules, explain fair value gap formation, walk through premium and discount arrays with clarity. What they cannot do is sit on their hands when there is no setup. Because somewhere in those thousands of hours of unstructured watching, their subconscious learned to find a setup in almost anything.
That is the real damage. Not bad trades. Manufactured trades, built from noise their own eyes trained themselves to see as signal.
What's Actually Happening Inside Your Pattern-Recognition System
Your brain does not file trading charts as neutral data. Every time you watch a session and feel the urge to enter, two things happen. If you take the trade and it wins, that pattern gets reinforced. If you take it and it loses, you rationalize why it almost worked. Either way, the behavior of looking for trades across every market condition gets rewarded neurologically.
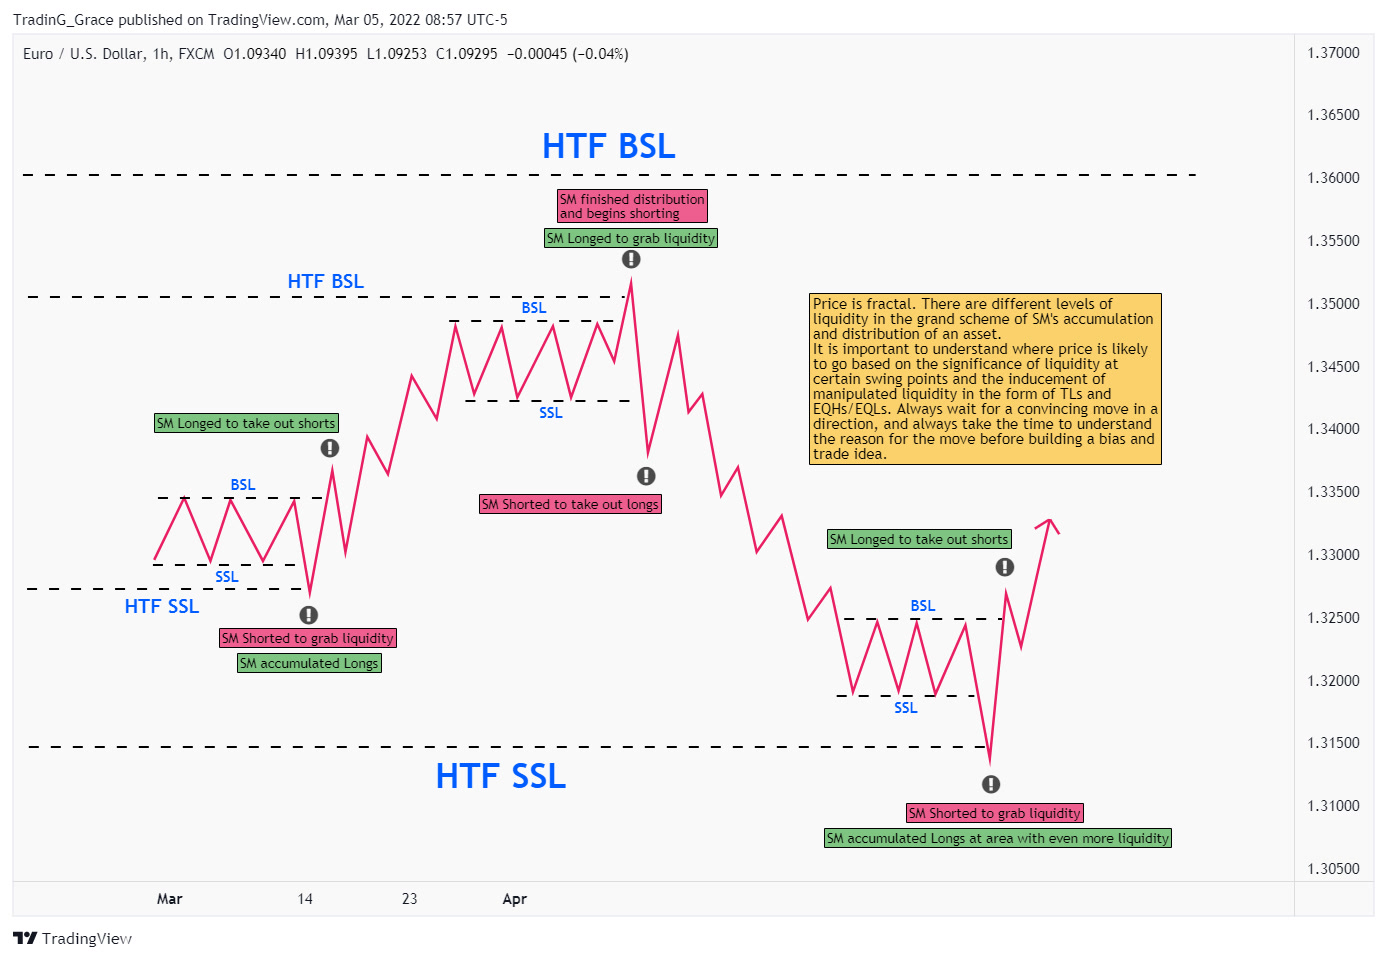
Over hundreds of sessions, this creates something I can only describe as a phantom confluence detector. You genuinely see a breaker block. You genuinely see a fair value gap. You genuinely believe the liquidity sweep just happened. But the reason you see all three converging is that you have spent 800 hours training yourself to find convergence, not to evaluate whether it is real.
Here is the part that most ICT YouTube content never addresses: ICT concepts are high-selectivity tools. They are designed to identify relatively rare, high-probability moments when smart money is positioned and the setup has institutional backing. They are not designed to generate two or three valid setups per session across six currency pairs. But when you are glued to screens all day, that is exactly the workload you are unconsciously trying to justify.
I used to get this wrong myself. Early in my trading, I equated presence with productivity. If I was not watching, I was missing something. What I was actually doing was slowly corrupting my own read of the market.
A Real Trade That Illustrates The Point
This past July on GBPUSD, 15-minute chart. London session, the first 45 minutes had produced a clean displacement to the downside, sweeping the Asian session low at 1.2683 before reversing with a strong bullish displacement candle. A fair value gap formed between 1.2691 and 1.2698 on the retracement. Higher timeframe bias was bullish: we had a clear daily order block that had held the week prior, and the weekly range was pointing toward a premium target near 1.2780.
I did not watch the trade form in real time. I had identified the setup criteria the evening before. The FVG was sitting in discount relative to the swing range. I had a limit order placed at 1.2693, stop at 1.2678, fifteen pips of risk at 0.75% of account. The trade executed during London open, ran to 1.2754 before I took partials at approximately 4.1R, letting the remainder run to the daily target.
Here is the relevant part: that trade required maybe 20 minutes of actual analysis the night before and perhaps 10 minutes of managing it the next day. A trader doing 12-hour screen sessions would have entered something on that pair at least four times before that clean setup materialized. Two of those entries would have looked almost as good. They would have eroded capital and, more importantly, eroded conviction in the actual setup when it arrived.
The quality of that 4.1R trade was only available to me because I was not already exhausted and committed to two earlier, lower-quality versions of it.
The Archetype I See Most Often at the Plateau
There is a specific trader type that gets stuck at the exact same level for six to twelve months. They know their ICT concepts cold. Their backtests look solid. Their trade reviews are detailed. But their live results cycle between breakeven and slow bleed, and they cannot understand why.
Almost universally, when you look at their trade log, the problem is not in their losing trades individually. It is in their trade frequency. They are taking valid-looking setups across New York, London, and sometimes even the Asian session. Six, eight, sometimes ten trades per week across multiple pairs. Each one has a rationale that checks boxes.
But here is the thing about ICT concepts specifically: the methodology is built around patience as a feature, not a personality trait to develop. The whole premise is that smart money moves on specific sessions, specific liquidity events, specific times of day. A trader taking ten setups a week is not being more thorough. They are leaking capital into the friction between truly institutional setups and the near-miss versions their trained eye has learned to see.
ICT trading consistency does not come from catching more moves. It comes from catching fewer moves, but catching them with higher precision. These are not the same thing, and treating them as equivalent is one of the most expensive misunderstandings in this space.
For more on how this shows up specifically in funded account environments, the 7 fatal mistakes that kill your funded account challenge success piece covers the downstream consequences when this frequency problem collides with prop firm drawdown rules.
The Framework: Structured Screen Time That Actually Builds Consistency
Here is how I would restructure a typical over-watching trader's week. This is not about trading less for the sake of it. It is about making every minute in front of the chart mean something specific.
Step 1: Pre-session analysis only (30 minutes, no live price action). Before any session opens, identify your higher timeframe bias on a maximum of two pairs. Mark your premium and discount arrays. Identify where the liquidity sits above and below. Write down the ONE scenario that would make you enter. Close the chart.
Step 2: Set your entry criteria in advance. If your scenario plays out, what does the trigger look like exactly? For ICT traders, this usually means a specific timeframe FVG in discount, a specific order block retest, or a breaker confirmation. Place your limit order if applicable. This forces precision before emotion enters the picture.
Step 3: Watch only the relevant session window. London open is roughly 7:00 to 10:00 AM GMT. New York killzone is 8:00 to 11:00 AM EST. These windows exist for a reason inside the ICT framework. Watching outside them is almost always noise collection. Set a timer. When the killzone closes, close the chart.
Step 4: Post-session review with a specific question. Not "how did I do" but "did the setup I identified pre-session materialize, and if not, why not?" This builds your read of the market over time without burning out your pattern recognition on low-quality data.
Step 5: Maximum two pairs, maximum one session per day. Spreading across six pairs feels like diversification. It is dilution. Your read of EURUSD is sharper when EURUSD is the only thing you have watched for four weeks straight.
For position sizing on any entries this framework produces, use our risk calculator to make sure your 1-2% risk parameters are dialed before anything touches the market. Sizing is the part traders rush when they feel urgency from watching too much.
The 2026 Market Context Makes This Worse, Not Better
Q3 2026 has produced choppier-than-usual intraday structure across major pairs, with liquidity sweeps failing to follow through as cleanly as they did in Q1. If you are already watching too much, that environment is burning traders alive. A fake liquidity grab in a choppy market looks almost identical to a real one on the lower timeframes. The only edge against that is being selective enough that you are not looking for confirmation in every swing.
This connects directly to what we covered in the Q2 2026 market structure shifts piece: the methodology still works, but the selectivity requirement has gone up, not down. More watching is the opposite of what this market rewards right now.
The Honest Version of What Consistency Actually Looks Like
Here is something I will say plainly because it is not popular: profitable ICT trading looks boring from the outside. Maybe three to six genuinely high-quality setups per month per pair. Long stretches where the market is not doing anything worth trading. Sitting on your hands while your brain screams that there is a setup forming.
The traders who reach real consistency, the ones you see in verified results, are almost always the ones who had to consciously break the screen-time habit at some point. They did not become patient naturally. They built a structure that made impatience difficult, and they stuck to it until their subconscious started recognizing quality over quantity.
If you are in the plateau right now, logging hours and watching your edge erode, the additional insight you need is probably not another YouTube breakdown of FVG mechanics. It is a structural change in how you are using your time in front of the chart, and sometimes that requires a second set of eyes that knows what to look for.
Our coaching plans range from a lighter weekly format at $150/week up to the full four-month mentorship at $5,000 if you want a completely rebuilt framework from the ground up. Or if you want to figure out what applies to your specific situation first, book a free discovery call and we can talk through where the actual problem is.
But before either of those: take one week and cut your screen time in half. Track the quality, not the quantity, of what you see in that week. That experiment will tell you more about where your edge actually lives than another month of full sessions will.
More hours is not the answer. A better question is.
Harvest Wright
ICT Trading Coach · 10+ Years Experience
Harvest specializes in ICT methodology and has helped traders pass prop firm challenges, develop consistent strategies, and build the psychology needed for long-term profitability.
Book a Free Discovery Call →Ready to Get Funded?
Our students pass prop firm challenges in under 60 days with personalized ICT coaching.
Book a Free Discovery CallFree ICT Funded-Trader Playbook
The setups, the pre-trade checklist, and the risk rules I use. Get it free.