Retail Sales Week: Trade USD With ICT
How ICT Trading Gives You an Edge on Retail Sales Week
Most traders see "Retail Sales" pop up on their economic calendar, maybe slap a wider stop on their current trade, and call it risk management. That's not a plan — that's just hoping for the best with extra padding.
This week, Retail Sales data hits the wire and I want you to be genuinely prepared. Not just "I know it's coming" prepared, but positioned prepared — with a clear map of where liquidity sits, where the institutional order blocks are, and how smart money is likely to engineer a move before and after the number drops.
I've been trading through high-impact and medium-impact news events for over a decade using ICT trading concepts, and consumer data releases like Retail Sales are some of my favourite setups of the month. Here's why: they're predictable in their mechanics, even when the number itself isn't predictable. And when you understand the mechanics, you don't need to guess the direction before the release.
Let me walk you through exactly how I approach the 24 hours surrounding this data.
Step 1: Map the Liquidity Landscape the Day Before
Before Retail Sales drops, your first job is to go to the Daily and 4-hour charts on the primary USD pairs you're watching — DXY, EURUSD, GBPUSD, USDJPY — and identify where the external range liquidity is sitting.
This means finding:
- Buyside liquidity — equal highs, prior day highs, session highs where retail traders have placed buy stops
- Sellside liquidity — equal lows, prior day lows, session lows where retail stop losses cluster
On a medium-impact release like Retail Sales, institutional participants don't typically reverse macro trend on the number alone. What they do use the release for is engineering a liquidity sweep — a sharp move into one side of that external liquidity before reversing toward the actual intended draw.
For this week, before the data drops, I want to see which side of liquidity is most obvious, most visible, and most obvious to retail traders. That's almost always the side smart money will hit first.
Practical action: On the day before Retail Sales, mark your swing highs and swing lows on the 4H going back 3-5 days. Circle the clusters. That's your liquidity map.
Step 2: Identify Your ICT Order Blocks on the 1H and 15M
Once you have the liquidity map, zoom into the 1-hour and 15-minute charts and start identifying bearish and bullish order blocks that align with the Draw on Liquidity you've identified.
An ICT order block in this context is the last down-close candle before a significant impulsive bullish move, or the last up-close candle before a significant impulsive bearish move. These are the zones where institutional orders were placed — and where price tends to return before continuing.
For a Retail Sales week setup, I'm specifically looking for order blocks that sit between current price and the nearest external liquidity pool. Why? Because if smart money wants to run stops at a prior high before reversing, they need an entry point — and that entry point is usually a mitigation of the nearest clean order block on the path toward that liquidity.
Here's the sequence I look for:
- Identify buyside or sellside liquidity as the likely first target
- Find an order block between current price and that target
- Wait for price to arrive at the order block and show a displacement — an impulsive, aggressive candle that breaks away from the block with a Fair Value Gap
- That displacement away from the order block toward liquidity is your signal the move is live
If you want a detailed pre-trade checklist for FVG confirmations specifically, I covered exactly that in my ICT Fair Value Gap trading checklist — nine confirmations I run through before entering any FVG setup.
Step 3: The 4-Hour Window Before the Release
This is where it gets tactical. In the four hours leading up to the Retail Sales announcement — typically in the London-to-New-York overlap or New York AM session — smart money almost always does one of two things:
Scenario A: Pre-news liquidity grab Price makes a sharp run into obvious retail stops (buyside or sellside sweep), then stalls. You'll see a clean wick, often followed by consolidation. This is the "false move" before the actual directional reaction.
Scenario B: Pre-news compression Price compresses into a tight range, building liquidity on both sides. This is a coil — and when the number hits, the release of that compression is explosive and directional.
In both scenarios, I am not entering before the number. I've been burned enough times over the years taking a pre-news position only to watch the data obliterate my setup. The juice is rarely worth the squeeze. The CPI trading strategy I broke down earlier this month applies the exact same pre-data patience — read it if you want a deeper dive on the psychological discipline required.
Step 4: The Post-Release Play — Reading the Reaction Spike
When Retail Sales hits the wire, you're going to see a spike. Here's how to read it with ICT trading eyes rather than retail trader eyes:
The first candle after the release is almost never the trade. It's usually a stop-hunt candle that overshoots before true price discovery occurs. Your job in that first 1-3 minutes is to watch, not click.
What I'm looking for:
-
Does the spike take out a major liquidity level? If the release number beats expectations and price rips up into a prior week high — that's a buyside sweep. Start watching for reversal confirmation.
-
Does the spike create a Fair Value Gap on the 5M or 15M chart? A gap left behind in the impulsive candle is often where price will return to before continuing. That gap-fill can be your entry.
-
Does price mitigate a clean order block after the initial spike? Post-release, institutional algorithms often retrace into the nearest order block before delivering the secondary, more sustainable move.
This three-part filter keeps you out of the noise and gets you positioned for the real move — which often comes 15-45 minutes after the initial spike settles.
For concrete reference, the CME Group's economic release calendar is worth bookmarking so you can cross-reference futures open interest positioning around these events.
Step 5: Your Trade Structure for Retail Sales Week
Here's the actual trade structure I use around medium-impact consumer data:
Entry: Post-release, after spike settles, on a 5M or 15M order block or FVG mitigation that aligns with the direction of the liquidity sweep
Stop Loss: Above or below the order block you're trading from — not above the spike high/low (that's too obvious and too wide)
Take Profit: The draw on liquidity identified in Step 1 — the opposing external range liquidity pool
Risk: No more than 0.5% per trade on a news day. I don't care how clean the setup looks. Consumer data can gap and reverse unpredictably and your account protection comes first.
This structure keeps your risk defined, your target logical, and your reasoning rooted in actual market mechanics rather than a gut read on whether the number was "good" or "bad."
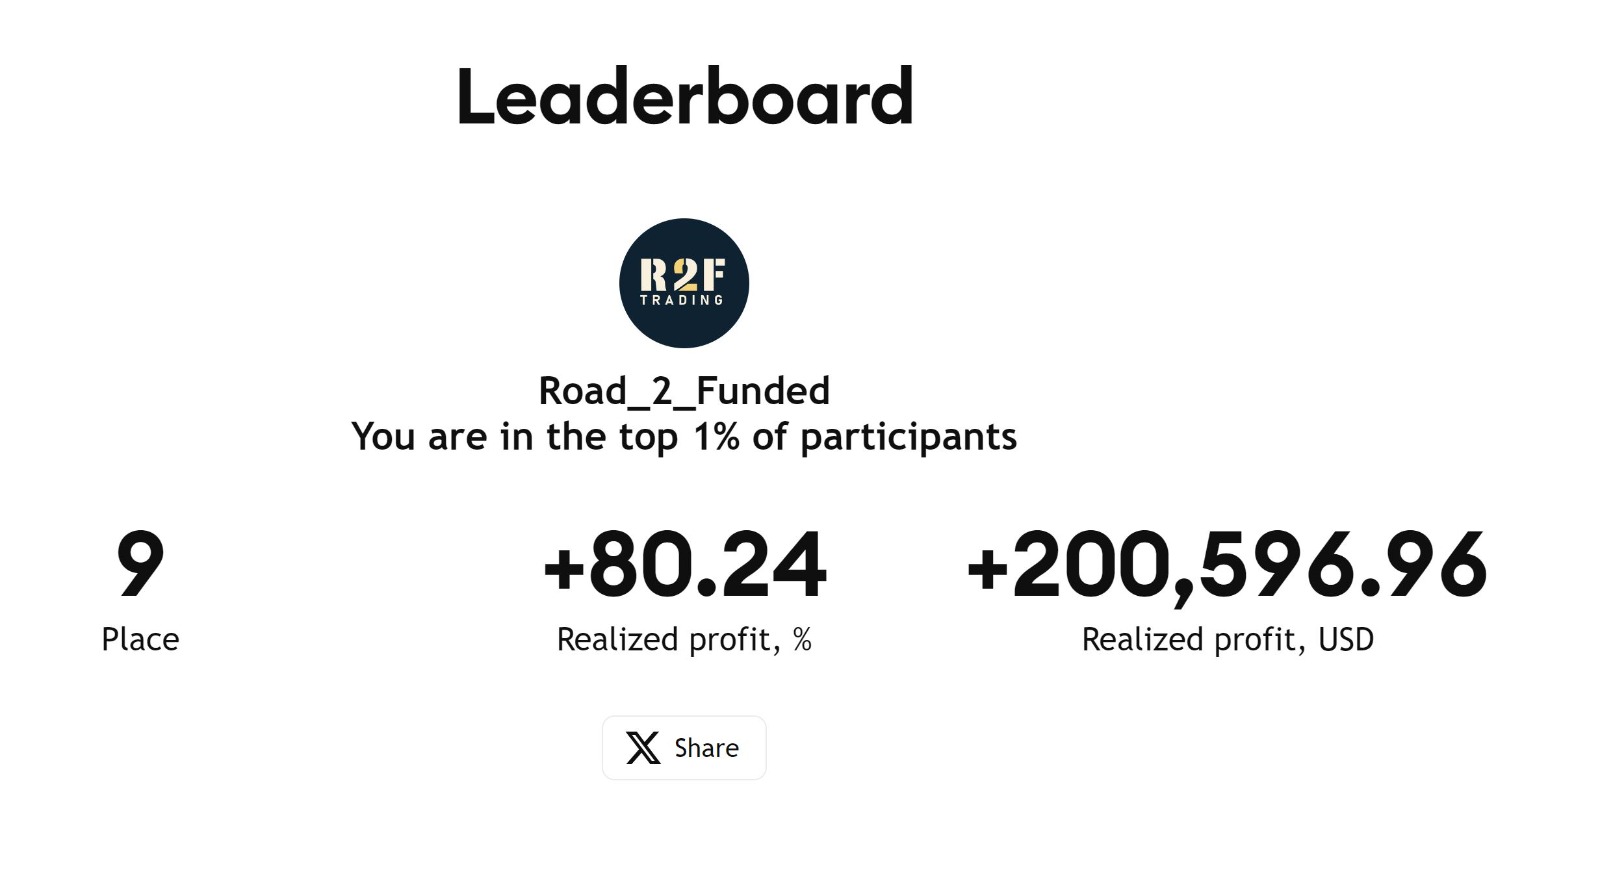
If you want to see how this same structured thinking has translated into real funded account results, check out the student results page — the traders who've gone through the mentorship process consistently cite news week trading as one of the areas where their confidence and consistency improved most.
Common Mistakes to Avoid This Week
I see traders destroy their week — and sometimes their funded accounts — on news events because of avoidable mistakes. A few to watch:
- Trading the first candle: Already covered, but it bears repeating. Wait.
- Widening stops "just in case" before the release: This is not risk management. If your setup can't survive normal pre-news movement, it's not a valid setup.
- Assuming direction from the headline number: A "beat" on Retail Sales doesn't automatically mean USD strength. Context, prior positioning, and market structure all override the raw number.
- Ignoring session timing: The New York AM session reaction and the London close reaction can tell very different stories. Know which session window you're trading.
If you want a comprehensive breakdown of how news-week mistakes compound into account failures — especially for prop firm challengers — my article on 7 fatal mistakes that kill your funded account challenge success is essential reading before this week's release.
For deeper background on how economic data releases are categorised and weighted by the market, Investopedia's guide to economic indicators is a solid reference point.
How I'm Approaching This Personally
For what it's worth, here's my personal approach this week: I'm watching GBPUSD and EURUSD primarily. The Dollar has been in a reactive environment post-Q1 macro shifts, and Retail Sales will either confirm or shake that narrative.
I've already marked my D1 and 4H liquidity pools. I have two potential order block zones identified on the 1H — one bullish, one bearish depending on which way the initial spike runs. I will not touch a chart within 5 minutes of the release time. And I will not force a trade if the post-release price action doesn't give me clean structure.
Patience is the edge. The setup either shows up or it doesn't.
Want to Learn This Approach With Direct Mentorship?
If this framework resonates with you and you want to learn how to apply it consistently — not just on Retail Sales week but on every high-probability setup throughout the year — that's exactly what I teach inside R2F Trading's coaching plans.
We have Lite mentorship at $150/week for traders who want structured guidance, Pro at $200/week for more intensive coverage, and Full Mentorship at $1,000 for 4 months if you want the complete transformation — from entry mechanics to psychology to prop firm preparation.
If you're not sure which level is right for you, the best place to start is to book a free discovery call and we'll figure it out together.
Retail Sales week is an opportunity. Come into it with a plan.
Harvest Wright
ICT Trading Coach · 10+ Years Experience
Harvest specializes in ICT methodology and has helped traders pass prop firm challenges, develop consistent strategies, and build the psychology needed for long-term profitability.
Book a Free Discovery Call →Take Your Trading to the Next Level
Get personalized 1-on-1 ICT coaching with Harvest Wright. Free discovery call, no commitment.
Book a Free Discovery CallFree ICT Trading Checklist
The exact checklist I use before every trade. Get it free.