
Retail Sales Week: How ICT Traders Prepare
How ICT Trading Gives You an Edge Before Retail Sales Drop
Every month, Retail Sales data hits the wire and the same thing happens — retail traders scramble, accounts blow up, and smart money cleans up. I've watched this cycle repeat for over a decade, and I can tell you with confidence that the traders who consistently profit around Retail Sales aren't guessing the direction. They're not glued to CNBC waiting for the headline number. They're prepared — systematically, methodically, 48 hours in advance.
This is exactly what ICT trading teaches you to do. Not react. Prepare.
In this article, I'm walking you through the exact routine I use — and teach to my students — in the 48 hours leading up to Retail Sales data. If you've been trading news events by feel and wondering why you keep getting wrecked, this is for you.
Step 1: Mark the Calendar and Set Your Context (T-48 Hours)
The moment I see Retail Sales scheduled on the economic calendar, I open my charts immediately — not to trade, but to document current market structure.
Retail Sales is one of the highest-impact USD data releases of the month, sitting right alongside CPI and NFP in terms of market-moving potential. The Bureau of Economic Analysis releases this monthly, and it measures consumer spending at the register level — which is roughly 70% of U.S. GDP. Institutional desks take this seriously. So should you.
At T-48, here's what I'm documenting:
- Weekly and Daily bias: Is price currently trading in a premium or discount array? Is the dollar index (DXY) sitting above or below a significant order block on the daily chart?
- Previous week's range: I mark the high and low. These are the first obvious liquidity pools that smart money will hunt before any directional move.
- Trend of the higher timeframe: Are we in a bullish or bearish market structure on the weekly? This tells me which side of the trade I want to be on after the liquidity grab, not before it.
This step is pure observation. No trades, no bias locking. Just mapping.
Step 2: Identify Your USD Pairs (And Eliminate the Noise)
Not every USD pair behaves the same around Retail Sales, and one of the biggest mistakes I see ICT students make is trying to trade too many instruments at once during a high-impact week.
Here are the pairs I prioritize:
Tier 1 — Highest Reaction:
- EUR/USD — Deepest liquidity, cleanest ICT setups, tightest spreads during news.
- GBP/USD — More volatile, but produces textbook liquidity sweeps and FVG entries.
- USD/JPY — Risk-on/risk-off dynamics amplify this pair's reaction to consumer spending data.
Tier 2 — Watch but Don't Force:
- AUD/USD and NZD/USD — These react, but the setups are often messier and less clean from an ICT perspective around this specific release.
- USD/CAD — Can move significantly but Canadian economic calendar sometimes overlaps and contaminates the read.
I typically focus on one or two Tier 1 pairs max. Going wide is a fool's game during high-impact weeks. If you want to understand why overtrading destroys funded accounts, I broke that down in detail in my piece on 7 fatal mistakes that kill your funded account challenge success — worth a read before this week.
Step 3: Map Your Liquidity Pools (T-24 Hours)
This is where ICT trading separates itself from everything else. While retail traders are looking at moving average crossovers and RSI divergence, smart money traders are asking one question: Where are the stop orders stacked?
At T-24, I drop down to the 4-hour and 1-hour charts and I'm hunting for three specific liquidity zones:
1. Equal Highs and Equal Lows Anywhere price has tapped the same level two or more times, stops are clustered just beyond that level. These are prime targets for pre-news liquidity raids.
2. Previous Day's High and Low (PDH/PDL) Retail stops sit just above and below the previous day's range almost every single time. On Retail Sales day, smart money will often engineer a sweep of one side before reversing hard in the opposite direction. I've seen this happen so consistently that I now plan for the fake move rather than getting caught in it.
3. Asian Session Range The Asia session before a major U.S. data release almost always forms a consolidation range. This range creates stop clusters on both sides. Mark it. It will be violated before the real move begins.
For a deeper breakdown of how these raids work and how to tell the difference between a genuine breakout and a manufactured sweep, check out my post on ICT liquidity grab vs stop hunt — 8 questions every trader asks. That article answers every question I get from students about this exact scenario.
Step 4: Identify Your Order Blocks and Fair Value Gaps
Once I've mapped liquidity, I shift focus to where I expect price to deliver after the raid. This is where order blocks and fair value gaps become my primary entry tools.
Order Blocks Before Retail Sales: I look for the last significant down-close candle before a bullish impulse (for long OBs) or the last up-close candle before a bearish impulse (for short OBs) on the 1H and 4H charts. The key is that these order blocks need to sit inside a discount array if I'm looking for longs, or a premium array if I'm looking for shorts.
Don't place your trade at the order block before the news. Wait. Let the data drop. Let the initial spike happen. Then watch for price to retrace into your OB in the minutes or hours after the release.
Fair Value Gaps (FVGs): FVGs created in the 15-minute or 1-hour timeframe in the 24 hours before Retail Sales are significant. These inefficiencies often act as magnets that price fills post-news. I mark every FVG I see in that window and treat them as potential fill targets or entry zones depending on the directional context.
If you want a full pre-trade checklist for FVG entries — not just the concept, but the exact nine confirmations I use — I published that in the ICT fair value gap trading checklist piece. Bookmark it for this week.
For additional context on how institutional order flow mechanics work, Investopedia's breakdown of smart money concepts is a solid external reference point if you're newer to the framework.
Step 5: The Night-Before Protocol (T-12 Hours)
The evening before Retail Sales, I run a final 30-minute chart audit. Here's exactly what I review:
- Confirm DXY bias — Is the dollar index sitting above or below key structure on the 4H? This determines my lean for EUR/USD and GBP/USD.
- Check overnight sessions — Has the London session already taken out buy-side or sell-side liquidity? If London already swept a high, I'm now expecting a continuation sell after NY Retail Sales confirms weak data, or I'm watching for a manipulation low before a NY rally on strong data.
- Set price alerts, not trades — I place alerts at my key order blocks, FVGs, and liquidity zones. I do NOT pre-position. This is a rule I've had to enforce on myself the hard way.
- Confirm my invalidation levels — Before any trade, I know exactly where I'm wrong. If price closes beyond a specific level, my thesis is dead. I note this the night before when I'm clear-headed, not in the heat of the release.
Step 6: The Release Window — What I Actually Do
Here's the part most traders get wrong. During the actual release, I do almost nothing.
I watch. I observe. I let the initial 1-3 minutes play out completely before I even think about entry. The initial spike is almost always engineered to trap traders on the wrong side. It's not the move — it's the setup for the move.
After the initial volatility settles (usually within 3-5 minutes of release), I look for:
- A return to a marked order block or FVG
- Market structure shift on the 5M or 15M chart confirming direction
- Confluence with my pre-mapped liquidity sweep (did they take the stops I identified? Good. Now what?)
Only when I have all three do I execute.
This patience-first approach is something I drill into every student across my coaching plans — whether you're on the Lite package at $150/week or working through the Full Mentorship program. The discipline to wait is the edge.
Why This Preparation Matters More Than the Trade Itself
I've seen students in my program go from blowing accounts on news events to consistently passing prop firm challenges — not because they got better at predicting data, but because they stopped predicting entirely and started preparing. The results speak for themselves, and you can see what structured ICT preparation does for real traders on the student results page.
The market doesn't reward guesswork. It rewards preparation, structure, and patience.
If this framework is new to you, or if you've been studying ICT concepts but struggling to apply them consistently around news events, I want to help you bridge that gap. The next step is simple — book a free discovery call and let's talk about where you are and what's actually holding you back.
Retail Sales week is coming. The smart money is already preparing. The only question is which side of the trade you want to be on.
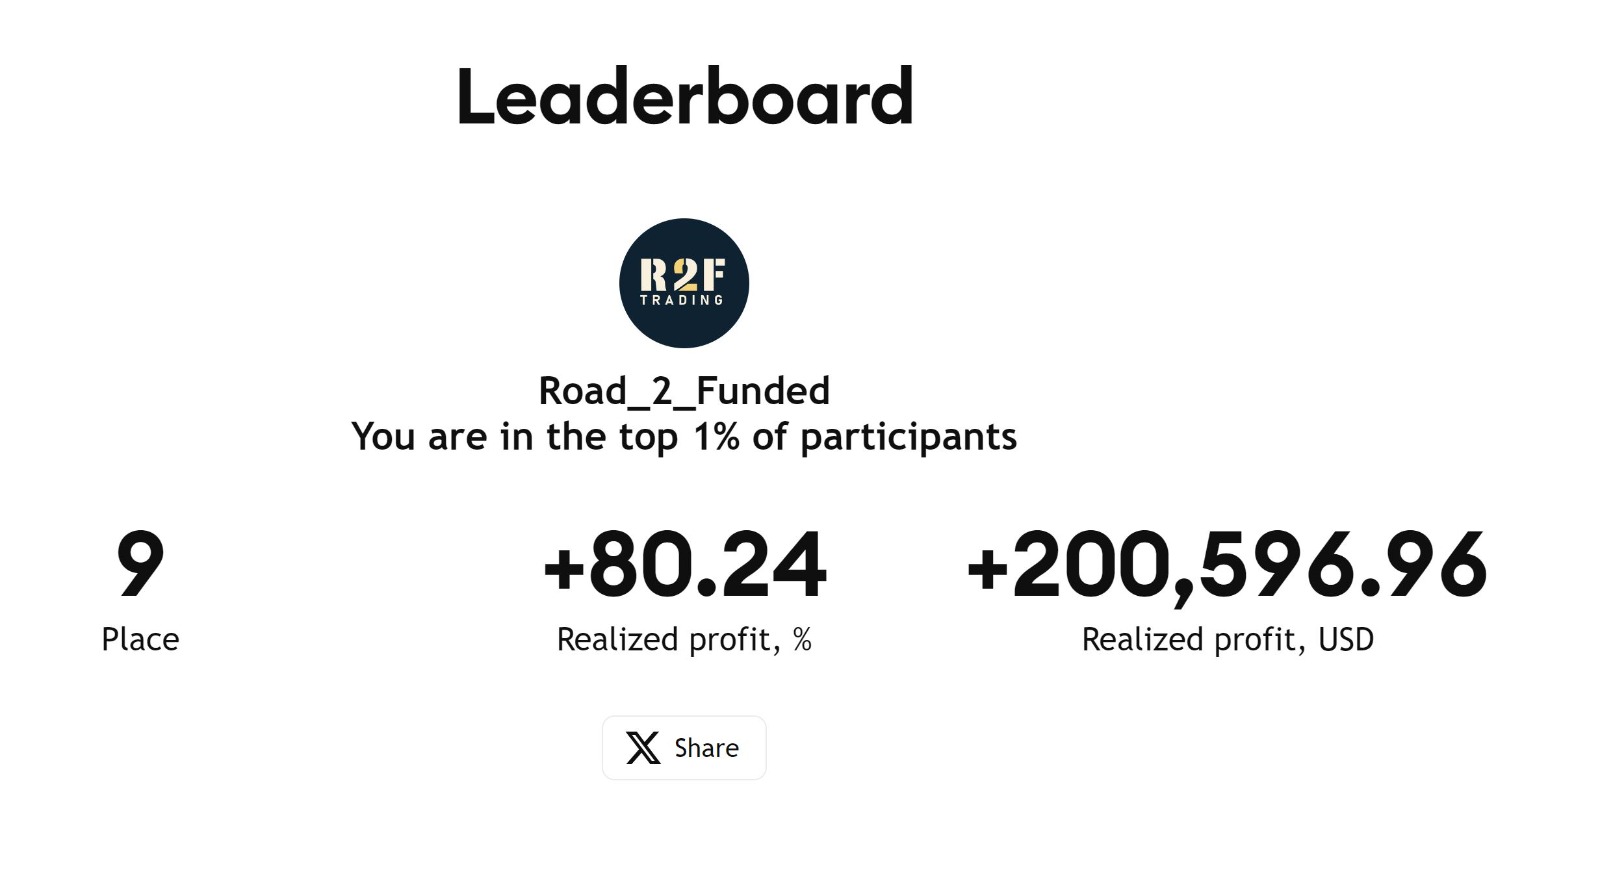
Harvest Wright is the founder and sole mentor at R2F Trading. With 10+ years of ICT trading experience, a TradingView Editors' Pick designation, and multiple top-1% competition finishes, he specializes in teaching institutional trading concepts to serious retail traders. For more market preparation guides and ICT breakdowns, visit the trading insights hub.
Harvest Wright
ICT Trading Coach · 10+ Years Experience
Harvest specializes in ICT methodology and has helped traders pass prop firm challenges, develop consistent strategies, and build the psychology needed for long-term profitability.
Book a Free Discovery Call →Take Your Trading to the Next Level
Get personalized 1-on-1 ICT coaching with Harvest Wright. Free discovery call, no commitment.
Book a Free Discovery CallFree ICT Trading Checklist
The exact checklist I use before every trade. Get it free.