
Retail Sales Week: Smart Money USD Traps
Every month, Retail Sales drops on the economic calendar and I watch the same thing happen in real time inside our community. Traders set alerts, prep their bias, and the moment the number prints, they charge in — long on a beat, short on a miss. Clean and simple, right? Wrong. Dead wrong. And it's costing traders accounts, challenges, and confidence every single cycle. After 10+ years applying smart money concepts to high-impact and medium-impact USD data releases, I can tell you with full confidence: the Retail Sales number itself is rarely where the real trade is. The real trade was built 24 to 48 hours before the release, while you were waiting.
This post is going to break down exactly how smart money engineers liquidity before Retail Sales week, why retail traders walk straight into the trap every time, and — more importantly — how you can learn to read the setup and position with institutional flow rather than becoming the exit liquidity for someone else's trade.
Smart Money Concepts and the Pre-Release Liquidity Setup
Let me be direct about something first. Retail Sales is classified as a medium-to-high impact USD event depending on the monthly deviation expectations. It directly influences consumer spending sentiment, which feeds into GDP projections and Fed policy expectations. Markets care about it — but not in the way most traders think.
The U.S. Census Bureau releases Retail Sales data monthly, and the headline number moves the dollar. What the textbooks don't tell you — and what most YouTube breakdowns skip entirely — is that before that number drops, large institutional players need to build their positions. And to build a position at scale, you need liquidity. Lots of it. That liquidity comes from one place: retail stop orders sitting above swing highs and below swing lows.
This is the foundation of smart money concepts applied to news week trading. Smart money doesn't react to news. It positions before news and uses the release as a displacement engine.
Step 1 — Map the 48-Hour Liquidity Pools
Two days before Retail Sales, open your USD pairs — I typically focus on DXY, EURUSD, and GBPUSD — and go to the 4H and daily charts. Your job is simple: identify where stop orders are resting.
Buy stops sit above obvious swing highs, equal highs, and prior session highs. These are the stops of short sellers and the entry triggers of breakout traders waiting for confirmation.
Sell stops sit below obvious swing lows, equal lows, and prior session lows. These are the stops of long holders and breakout shorts waiting for a breakdown confirmation.
Mark every significant cluster of resting liquidity on your chart. Don't guess — let price structure show you. If you see equal highs printed over two or three sessions, that's a magnet. Institutions know it. You should too.
If you want to go deeper on identifying these structures before a major data event, my breakdown of how April NFP week liquidity patterns create hidden ICT entry opportunities covers the same framework in a different catalyst context — the principles translate directly to Retail Sales week.
Step 2 — Watch for the Pre-Release Consolidation
This is the part most traders sleep through because it looks boring. In the 24-36 hours before Retail Sales, price on the major USD pairs will often enter a range — a tight, compressed consolidation that retail traders read as "wait and see" price action.
It is not wait and see. It is accumulation or distribution. Smart money is quietly building directional positions inside that range, and the compression is the signature. On a 15-minute or 1-hour chart, you'll see price repeatedly probe both sides of the range — tapping into buy stops above, pulling back, tapping into sell stops below, pulling back again.
Each of those probes is a raid. Each raid is collecting liquidity that feeds institutional order flow. The direction that gets raided last — and then reversed aggressively — is typically the direction smart money has been positioned against.
This is not a random pattern. It is mechanical. And once you've seen it five or ten times across major data releases, you cannot unsee it.
Step 3 — Identify the Order Block That Caused the Raid
Once price sweeps a liquidity pool — say, taking out buy stops above a swing high — you need to immediately drop to the 5-minute or 15-minute chart and identify the order block that initiated the move into that liquidity.
An order block in ICT methodology is the last down-close candle before a bullish displacement, or the last up-close candle before a bearish displacement. It represents the zone where institutional orders were placed that drove price into the liquidity pocket.
After the sweep, price will often retrace into that order block before the actual directional move begins. That retracement is your entry window. That is where you want to be — not chasing price after the Retail Sales number drops on the wire.
I've covered the pre-trade confirmation process for fair value gaps and order blocks in detail in the ICT Fair Value Gap trading checklist — highly recommend reviewing that alongside this framework if you want a complete pre-entry process.
Step 4 — Wait for Displacement, Not the Number
Here's where discipline separates profitable traders from funded account casualties. When Retail Sales prints, your instinct will be to trade the number. Resist it. The number is not your signal. Displacement is your signal.
Displacement is an aggressive, impulsive price move away from a key level that leaves behind a Fair Value Gap (FVG) on the lower timeframes. It confirms that institutional orders have been triggered and that the directional move has institutional backing — not just retail momentum.
If price sweeps the sell stops below a key low in the 30 minutes before the release, retraces into your identified order block, and then on the Retail Sales release displaces aggressively to the upside — leaving an FVG on the 5-minute — that is a high-confluence long setup. The news didn't create the trade. The pre-release liquidity engineering created the trade. The news was just the trigger.
If you're running a funded account or prop challenge when you try to implement this, the risk management layer is critical. One of the most common ways traders blow challenges is by over-leveraging into news events without a pre-defined invalidation level. I broke down the exact mistakes that kill funded accounts in 7 fatal mistakes that kill your funded account challenge success — it's required reading before you trade any medium or high impact event.
Step 5 — Structure Your Entry and Define Your Invalidation
Once displacement confirms and you have a retracement entry into the FVG or order block, your trade structure should look like this:
Entry: Inside the Fair Value Gap or at the top of the order block (for longs) / bottom of the order block (for shorts), on the lower timeframe confirmation — typically a 5-minute market structure shift in your direction.
Stop Loss: Below the order block for longs. Above the order block for shorts. You are not giving price room to revisit the liquidity zone that was already swept — if it does, your thesis is invalidated.
Target: The opposing liquidity pool identified in Step 1. If price swept sell stops and is now moving up, your target is the buy stops sitting above the next significant swing high. Let smart money do the work — they need to deliver price to that liquidity to close their position.
Risk: No more than 1% of account on a single news-week setup. These moves can extend fast and reverse just as fast. Discipline on position sizing is non-negotiable.
You can track current USD market structure and Retail Sales positioning data in real time using tools like TradingView — their economic calendar combined with multi-timeframe charting is the most efficient way to execute this framework in live markets.
Why Retail Traders Keep Getting Trapped
The reason this trap works so consistently comes down to psychology and information asymmetry. Retail traders use the news as their signal. Institutions use retail traders' reaction to the news as their exit. By the time the headline prints and retail piles in, smart money has already been positioned for hours — sometimes days. Retail entries become the fuel that drives price to the institutional target, at which point distribution begins and the move reverses.
This is not conspiracy. This is market structure. Understanding it through the lens of smart money concepts is what transforms you from exit liquidity into someone who reads the game correctly.
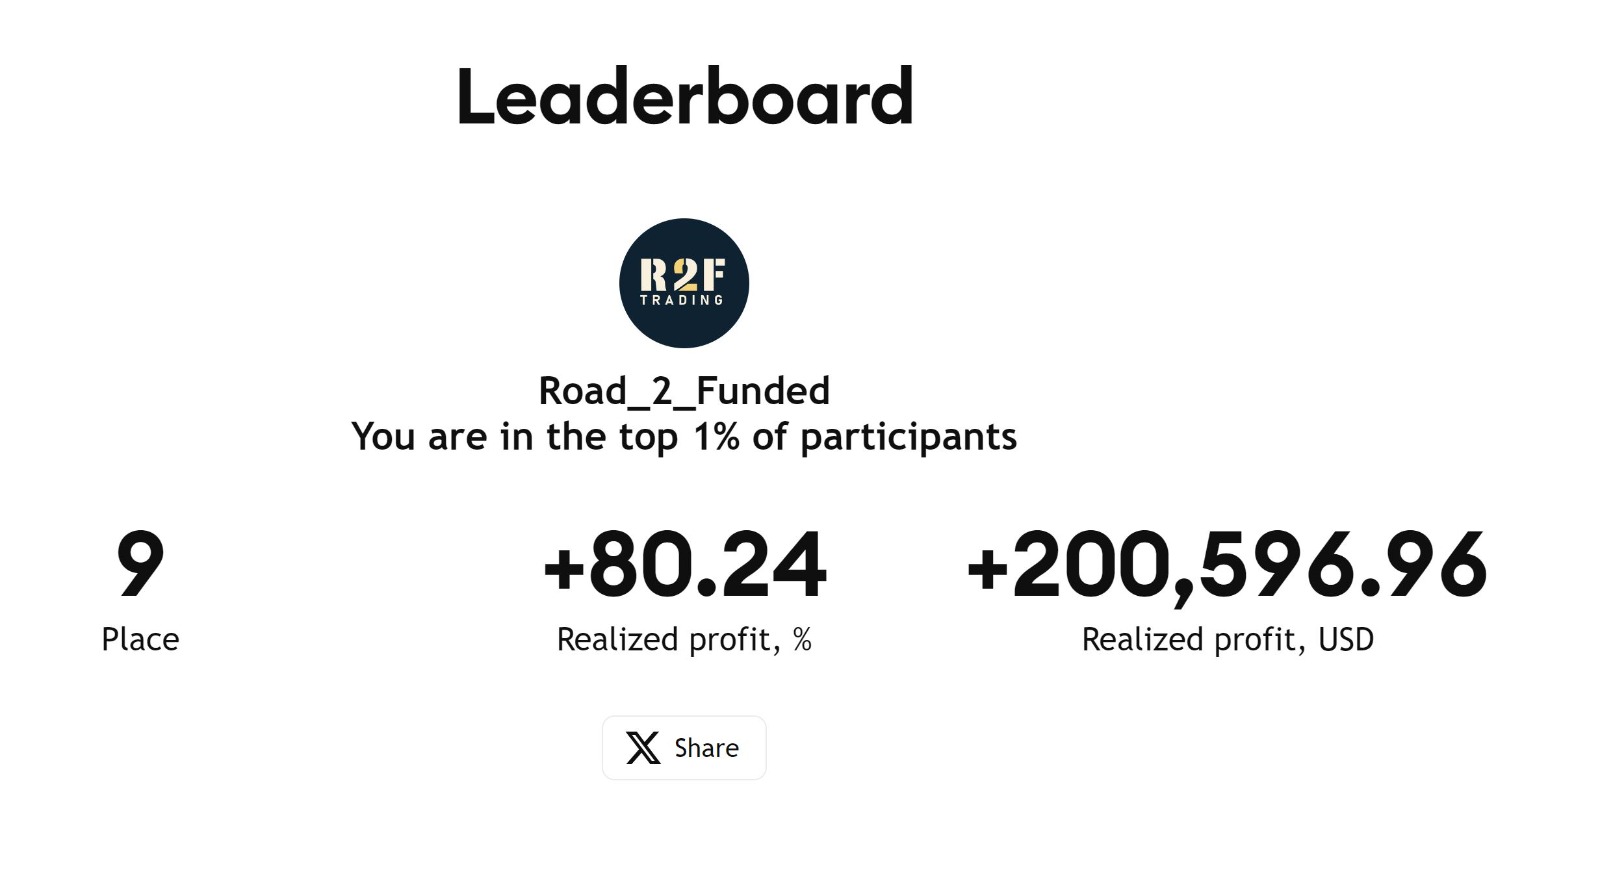
If this framework resonates with you and you want to apply it consistently — not just during Retail Sales week but across every major USD catalyst — that's exactly what we build inside our coaching plans. The Lite plan at $150/week, Pro at $200/week, and Full Mentorship at $1,000 for four months are all structured around teaching you to read institutional footprints in real time, using the same methodology I've used to pass FTMO challenges and finish in the top 1% of trading competitions. You can see how students have applied these frameworks in our student results.
If you want to explore which level of mentorship fits where you are right now, book a free discovery call and let's map it out together.
The Bottom Line
Retail Sales week is not a coin flip. It is not a guess based on the deviation. It is a 48-hour institutional setup that retail traders walk into blind every single month because they're focused on the number instead of the structure behind it.
Learn to map the liquidity pools. Identify the pre-release consolidation. Find the order block. Wait for displacement. Trade the institutional move — not the headline.
That's how smart money concepts turn a news event from a gambling session into a structured, high-probability trade. And once you see it clearly, you won't be able to look at Retail Sales week the same way again.
Harvest Wright
ICT Trading Coach · 10+ Years Experience
Harvest specializes in ICT methodology and has helped traders pass prop firm challenges, develop consistent strategies, and build the psychology needed for long-term profitability.
Book a Free Discovery Call →Take Your Trading to the Next Level
Get personalized 1-on-1 ICT coaching with Harvest Wright. Free discovery call, no commitment.
Book a Free Discovery CallFree ICT Trading Checklist
The exact checklist I use before every trade. Get it free.