By Harvest Wright, updated 27 October 2026
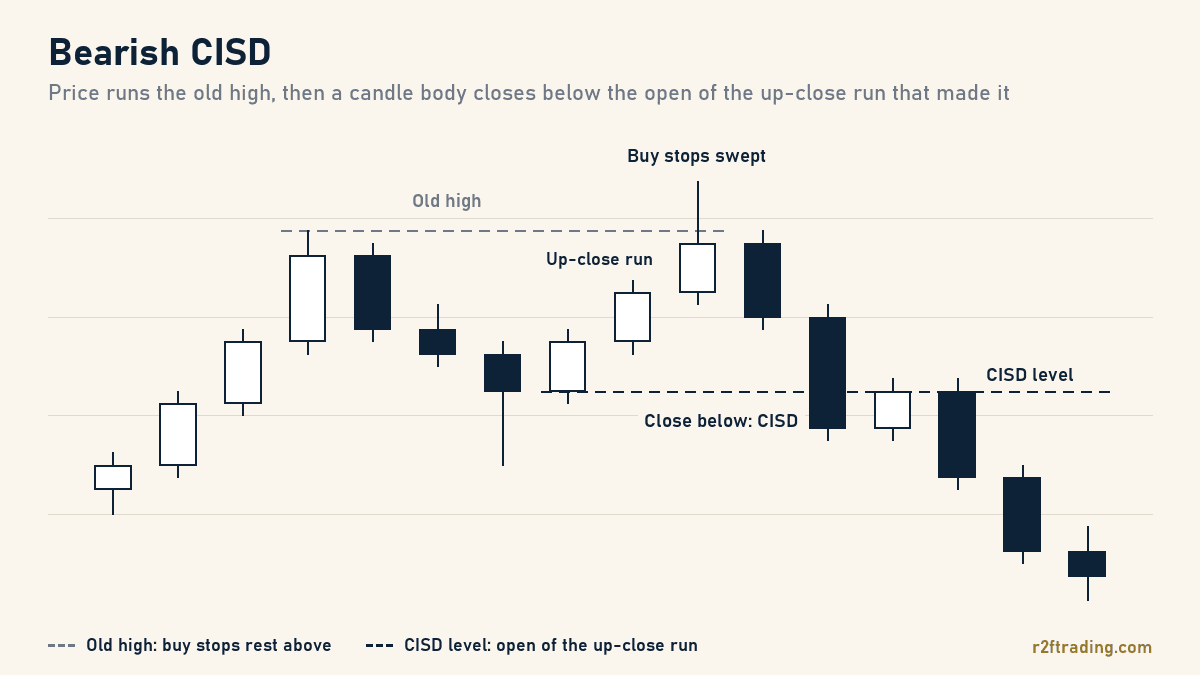
CISD stands for change in state of delivery, an ICT term for the moment price stops delivering in one direction and starts delivering in the other. In CISD trading you read it from opening prices: a bearish CISD prints when a candle body closes below the opening price of the up-close candle, or run of up-close candles, that drove price into the high. A bullish CISD is the mirror image. It often follows a liquidity sweep and usually shows up earlier than a full market structure shift.
What is CISD in trading?
In a rally, the candles doing the work are up-close candles: each one opens, travels higher and closes above its open. ICT calls that a bullish state of delivery. When a candle closes below the opening price of the candles that built the rally, delivery has changed state, and that close is the CISD.
Most structure tools are read from swing highs and lows, which can sit a long way from price. A CISD is read from the opens of the candles that delivered the last move, so it reacts to a turn sooner. That speed is the appeal, and it is also why a CISD needs context before you trade it.
Those up-close candles at the high are the same ones many ICT traders mark as a bearish order block. A close through the open of that block shows the move that built the high has turned.
How a bearish CISD forms
The sequence is the same on every timeframe:
- Price rallies into a high, often running above an obvious old high first to take the buy stops resting there. That is a liquidity sweep.
- Find the up-close candles that delivered price into that high. For a single candle, use its opening price. For a run of consecutive up-close candles, the usual reference is the open of the first candle in the run.
- Draw a line at that opening price. This is the CISD level.
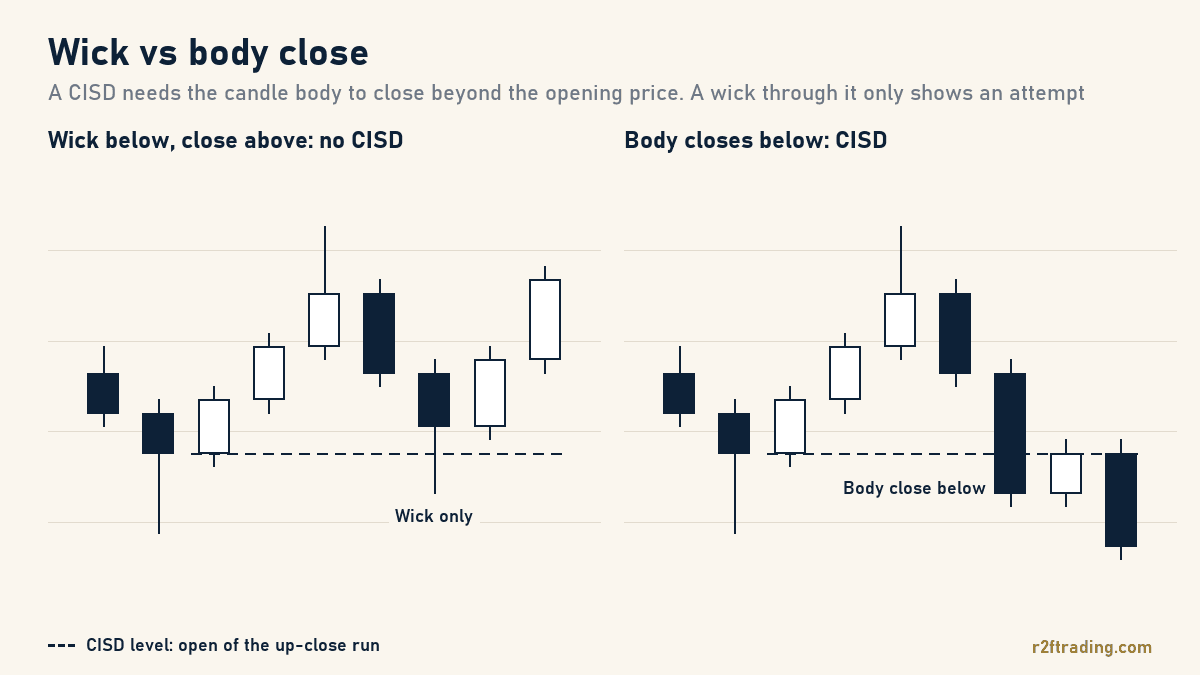
- Wait for a candle body to close below the line. A wick through it is only an attempt.
- Once that close prints, delivery has turned bearish on that timeframe. Sellers look for price to come back toward the line, or into a fair value gap left by the drop.
How a bullish CISD forms
A bullish CISD is the mirror image. Price drops into a low, often running the sell stops below an old low first. Mark the opening price of the down-close candle, or run of down-close candles, that delivered price into that low. When a candle body closes above that open, delivery has turned bullish, and buyers look for the retrace back toward the level.
Why the candle body has to close
A wick that pokes through the opening price and snaps back shows the other side tried and failed. Delivery has not changed until a candle closes beyond the level.
On stream I like to say the bodies tell the story and the wicks do the damage. Wicks run stops. Bodies show where price was accepted when the candle finished. That is why I track when each candle opens and closes, and wait for the close before I act.
CISD vs market structure shift
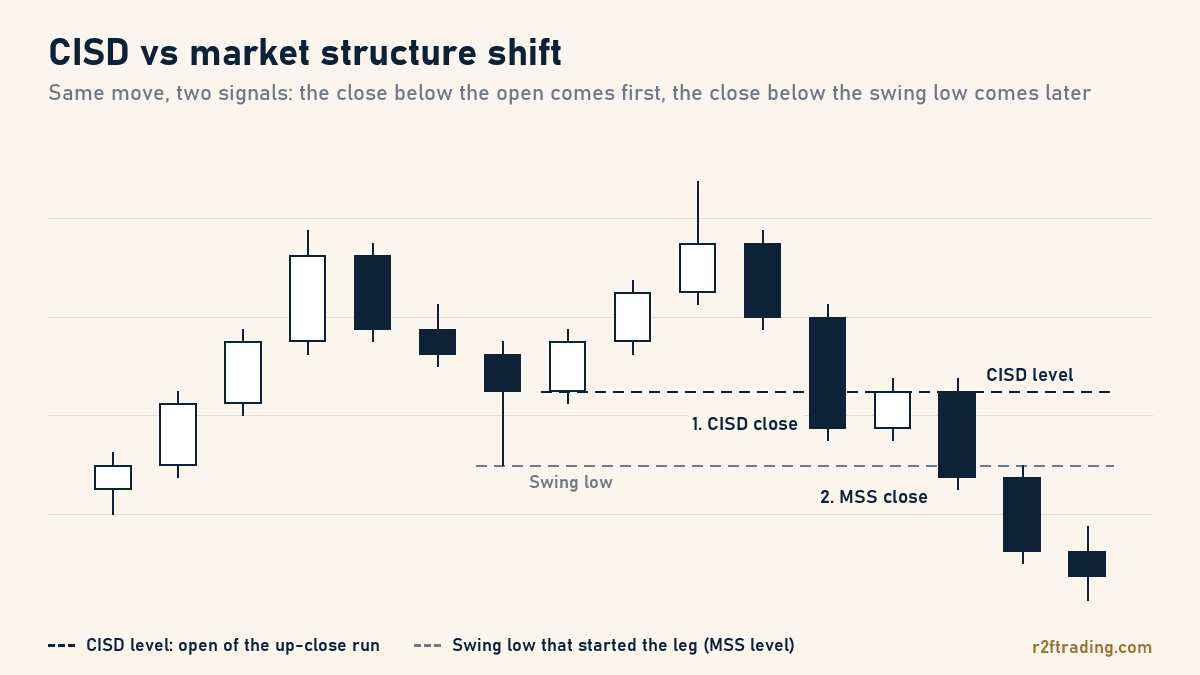
A market structure shift (MSS) needs a close beyond the swing high or low that started the last leg, usually with displacement. A CISD only needs a close beyond the opening price of the candles that delivered that leg. On a bearish turn that open normally sits above the swing low, so the CISD prints first and the MSS comes later, if it comes at all.
- CISD: earlier, read from opening prices, a smaller stop, and more false starts in choppy conditions.
- MSS: later, read from swing points, more evidence that the turn is real, and a wider stop.
- Together: many traders treat the CISD as the first warning and the MSS as the confirmation.
CISD vs change of character and break of structure
Break of structure (BOS) and change of character (CHoCH) are the terms most smart money concepts traders use, and both are read from swing points.
- [Break of structure](/learn/what-is-a-break-of-structure): a close beyond a swing in the direction of the trend. The trend is still going.
- [Change of character](/learn/what-is-change-of-character-in-trading): the first break of a swing against the trend. Many traders use it for the same event ICT calls a market structure shift.
- CISD: a close beyond the opening price of the candles that delivered the last move. No swing has to break, so it often comes before a CHoCH.
Where traders define CISD differently
Traders who learned CISD from different sources apply it differently. Pick one version, write it down and apply it the same way every time, so your journal compares like with like. These are the usual differences:
- Which open. The common version uses the first candle in the run that made the high. Some use only the last up-close candle, which gives an earlier and noisier signal.
- What counts as a run. Some allow a small opposite candle inside it. Others restart the count at any opposite close.
- Context. Some only call it a CISD after a liquidity sweep. Others mark every one and filter later.
How I use a CISD
On one London session I called a setup on the chart "a breaker block or change in the state of delivery". The label matters less to me than the candle close in the direction of my bias. While I wait for one, you will hear me say things like "we just have to close above this down candle here." This is where it fits in my process:
- Set the bias first. I work top down from the higher timeframes. A bearish CISD only interests me when the daily chart points lower. Here is how I find the daily bias.
- Mark the point of interest before price gets there. A higher timeframe PD array such as an order block or fair value gap, or an obvious pool of liquidity. A CISD in the middle of nowhere tells me very little.
- Wait for the return, then drop a timeframe. On the 5 or 15 minute chart I wait for a candle in my direction to close through the open of the candles that brought price there. That close is my confirmation.
- Put the stop where the idea is wrong. For a bearish setup that is above the swept high, or above the confirmation candle if I want a tighter stop. A new high beyond the sweep means the turn has failed.
- Target the low-hanging fruit. My first target is the nearest obvious liquidity: the swing low that started the leg, a gap below, or equal lows.
What makes a CISD worth trading
- A sweep first. A run on an obvious high or low means the stops that fuelled the old direction have been taken.
- A level marked in advance. The CISD prints at a higher timeframe order block, fair value gap or breaker block.
- A real body. Displacement through the opening price, ideally leaving a fair value gap behind.
- The daily bias agrees. A CISD against it is a warning at most.
- Timing. The London and New York opens carry more weight than the quiet hours. See killzones.
Common CISD mistakes
- Measuring from the wrong candle. Use the open of the candles that delivered price into the high or low.
- Acting on a wick through the level before the candle has closed.
- Treating every CISD as a reversal. On low timeframes they print all day inside ranges.
- Putting the stop at the CISD level itself, where a normal retest takes it out.
What timeframe works best for CISD?
A CISD can form on any timeframe, and the logic stays the same. The higher timeframe tells me where to look, and the lower timeframe tells me when: I mark the point of interest on the daily and 4 hour charts, then look for the close on the 5 or 15 minute.
If you want to watch me wait on candle closes in real time, I trade the London open live every weekday. The live schedule shows the start time in your time zone.