
GDP Shock? How Smart Money Reacts vs. You
Every GDP release day, the same scene plays out across trading desks and Discord servers worldwide. The number drops. Price spikes. Retail traders scramble — some chasing the initial move, some waiting for a "retest," most getting wrecked by 10:30 AM. Meanwhile, if you watch the tape closely using smart money concepts, you start to notice something strange: the big move often started before the number hit, or it reversed hard into a level that had nothing to do with the headline figure. After 10+ years watching this pattern repeat, I can tell you with confidence — most traders are solving the wrong puzzle.
Key Takeaway: Smart money doesn't trade the GDP headline — it trades the narrative shift triggered by prior quarter revisions, which are buried in the report's fine print. The real edge on GDP day is knowing which number to ignore and which one just changed the institutional thesis.
The Anchoring Trap Nobody in ICT Communities Talks About
Here's the specific cognitive bias at play: anchoring. When the GDP report drops, your brain locks onto the first number it sees — the headline print. Q1 GDP comes in at +2.1% annualized versus an expected +1.8%? Your brain immediately files that as "better than expected, dollar bullish." Done. Decision made. You're already reaching for the buy button on DXY-correlated pairs.
But here's what you missed in the three seconds it took you to read that headline: the prior quarter GDP was revised down from +3.1% to +2.4%.
That revision just erased 0.7% of annualized growth from the existing economic picture. The headline beat looks impressive in isolation. In context, the trend just got materially weaker. The U.S. Bureau of Economic Analysis releases these revisions in the same report, same timestamp — but they're buried three paragraphs down, and retail traders almost never get there before they've already clicked buy.
Institutions ran models on that revised prior quarter data weeks ago. They had scenarios prepared. When the print confirms their revised thesis, they're executing a plan — not reacting to a number.
You're reacting. They're confirming.
That gap in process is the entire ballgame.
What I Actually Saw on the Last Major GDP Release
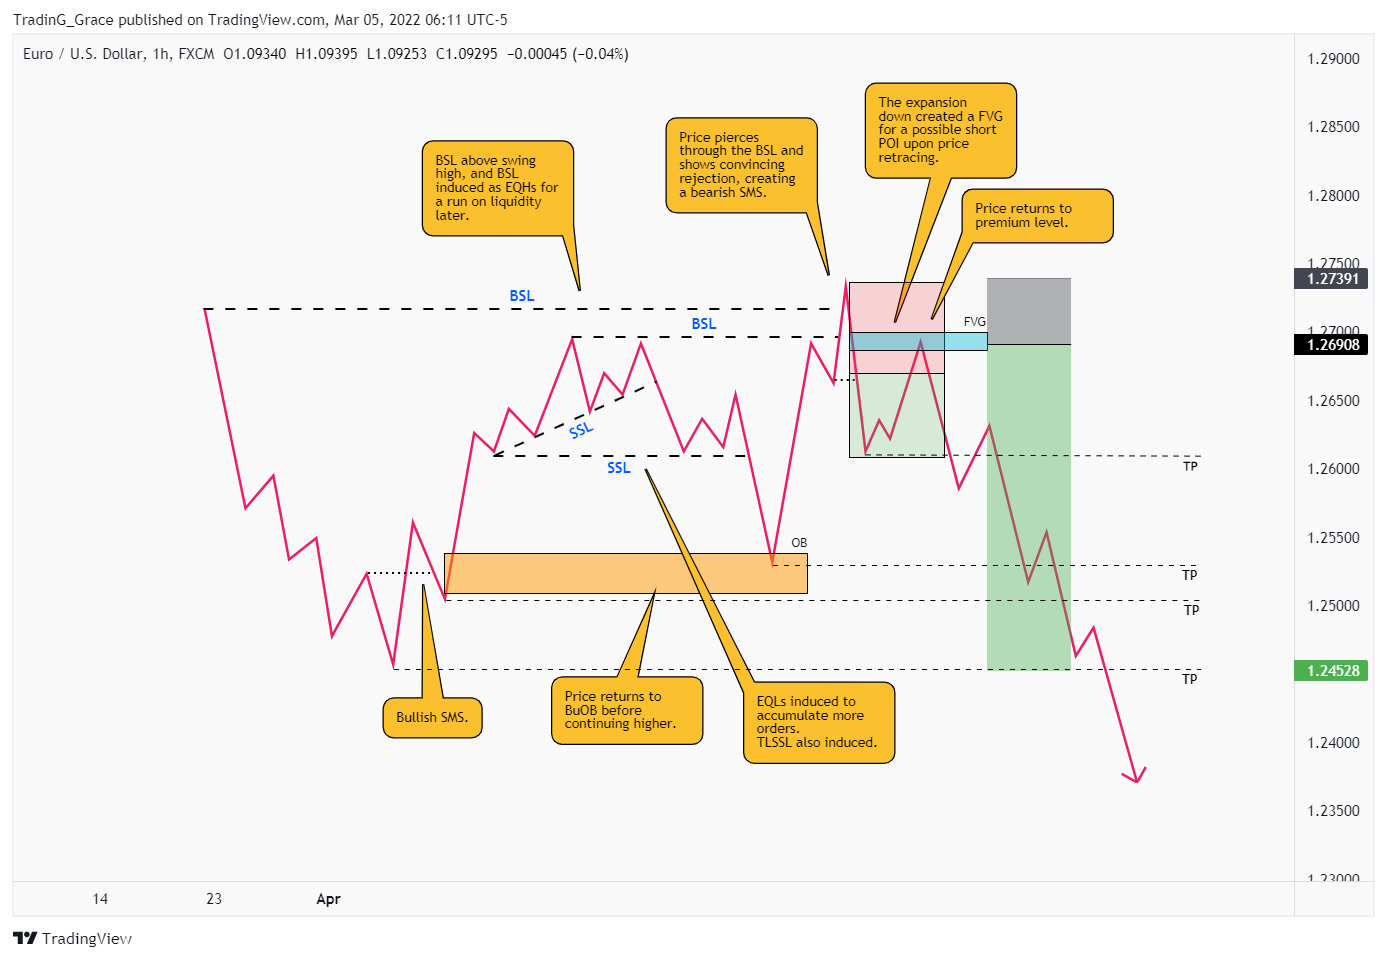
Let me give you a specific example. On a Q1 2026 GDP release day, I was watching GBPUSD on the 15-minute chart during the New York session open. Pre-release, price had swept the Asian session highs — a clean liquidity grab above a short-term swing — and returned back below a 4-hour bearish order block sitting at 1.2734.
The GDP headline came in slightly above expectations. Immediate reaction: price spiked up about 35 pips, breaking back above the OB. Every retail trader watching the cable saw "USD weak, buy GBP" and chased the pop. That initial candle closed as a full-body bull candle. Looked clean. Looked impulsive.
I waited.
I pulled up the actual BEA release and checked the prior quarter revision. Prior Q4 GDP had been revised down by 0.6%. Simultaneously, PCE deflator data embedded in the same report came in hotter than expected — stagflation signal, not growth signal. The headline beat was technically accurate and contextually misleading at the same time.
Within 11 minutes, price returned to the OB at 1.2734. I entered short at 1.2731 with a 14-pip stop above the OB high, risking 0.75% of account. The trade ran to the daily low-end FVG at 1.2648 — 5.9R — before I took full position off. The entry reason wasn't the GDP number. It was the narrative shift: institutions that had been positioned long into a "growth beat" scenario now had prior quarter revisions contradicting the trend. They were offloading into the retail chase.
That's smart money concepts applied to a macro release. Not indicator stacking on the headline.
The "Confirmation Junkie" Archetype
There's a specific type of trader I see get absolutely destroyed on GDP days. Call them the Confirmation Junkie.
This trader has actually done the work. They've watched the ICT content, they understand fair value gaps, they can draw order blocks with precision. Their technical analysis before the release is genuinely good — they've identified the premium/discount levels, they know where liquidity sits, they've marked the dealing range. And then the GDP number drops, and they immediately look for technical setups that confirm the headline narrative.
Headline comes in bearish for DXY? They hunt for bearish FVGs and bearish OBs. Every structure they see now looks like confirmation of the macro move. They're not reading price — they're reading price through the filter of a number they've already anchored to.
The brutal irony: their technical analysis was correct before the news. They had the right levels. They just let a headline override the structure that was already telling the story.
Smart money concepts work precisely because they strip narrative and focus on where price has to go to collect liquidity. A GDP miss doesn't move that Asian session low. The institutional order flow that was already building doesn't suddenly evaporate because a number printed 0.3% off expectations. But the Confirmation Junkie abandons the structure they spent two hours building and chases the spike instead.
I used to do this exact thing. In my earlier years, I'd spend an hour marking up a chart, then a news event would hit and I'd completely discard my analysis in favor of "trading the news." The result was entries in premium on emotional momentum, followed by stops and confusion. The chart I'd marked up beforehand was right. I just stopped trusting it the moment a headline gave me something more "certain" to react to.
Smart Money vs. Retail: A Direct Comparison
| | Retail Trader on GDP Day | Smart Money / Institutional Positioning | |---|---|---| | Primary focus | Headline GDP print vs. consensus | Prior quarter revision + trend change | | Timing | Reacts after release | Positioned days/weeks before, confirms on release | | Data sources | Financial news ticker, Twitter/X | Full BEA report, PCE deflator, employment cost data in same release | | Decision framework | "Better/worse than expected" binary | Narrative shift assessment — does this change the multi-quarter thesis? | | Execution style | Chase the spike, enter at extension | Distribute into retail momentum, or fade the emotional overshoot | | Stop placement awareness | Placed at nearest swing, easily swept | Already knows where retail stops cluster; targets them on the spike |
This isn't a cynical take. It's just mechanics. If you understand that institutions need liquidity to fill large orders, then a GDP spike that drives retail traders into chasing long positions has just created the sell-side liquidity institutions need to offload. The spike isn't the trade. The spike is the fuel depot they're pulling up to.
For a deeper breakdown of how liquidity raids function around news events, the April 2026 earnings season liquidity raids piece covers the mechanics in detail — the pattern on GDP day is structurally identical.
The Pre-Release Framework I Actually Use
Here's exactly how to approach a GDP release without getting trapped by the headline anchor. This is practical, not theoretical.
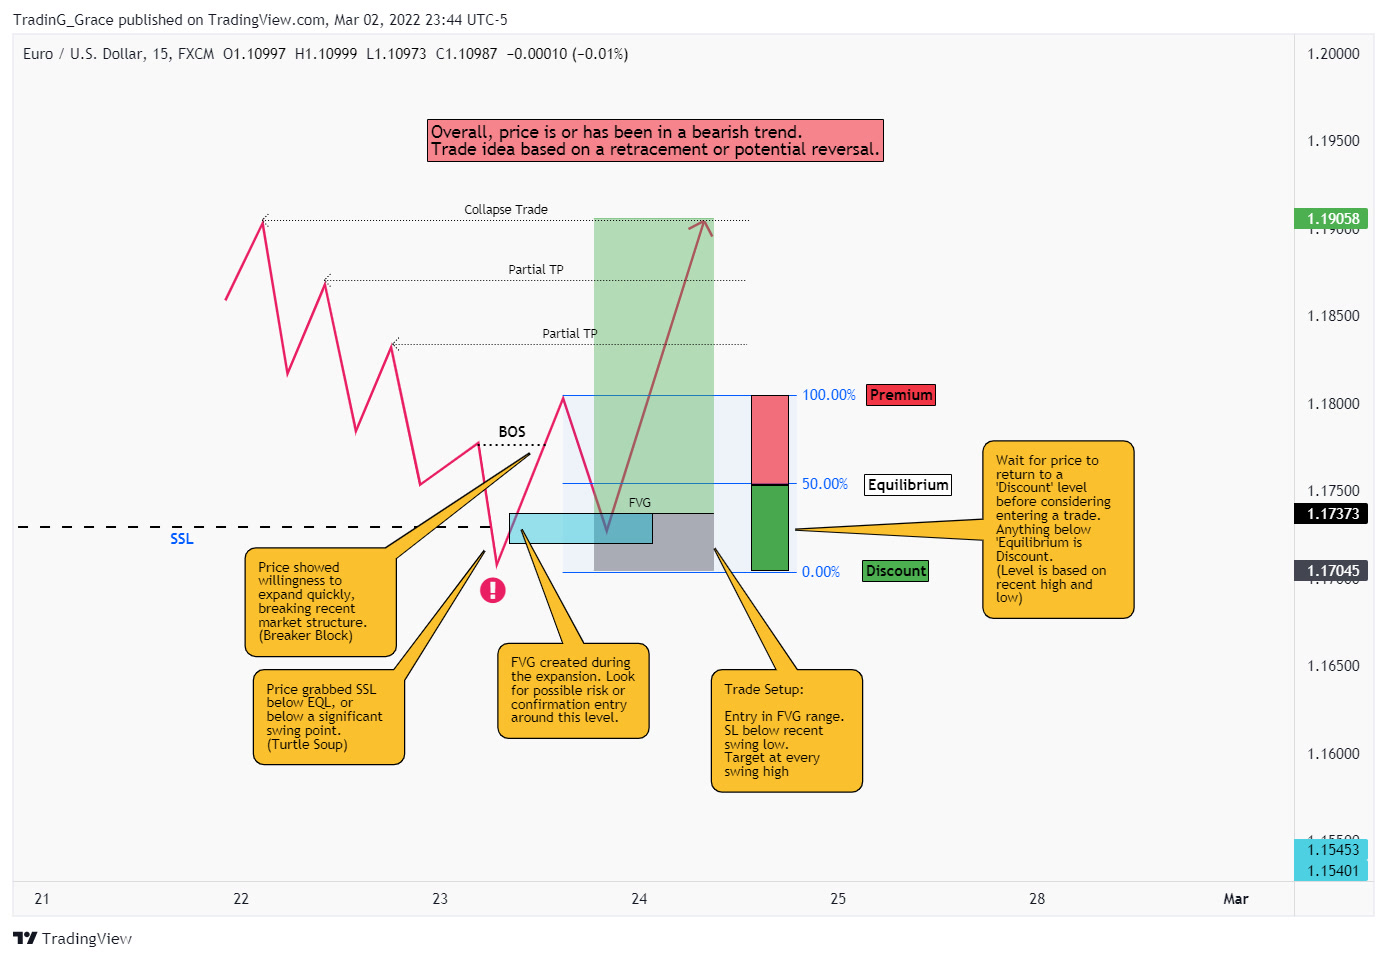
Step 1 — Mark your chart the night before. Identify the weekly and daily PD arrays. Where are the premium and discount zones? Where does liquidity rest above and below? Do this with zero reference to what GDP is expected to print. Your structure should stand alone.
Step 2 — Set a 30-minute news blackout rule. After the release, no entries for 30 minutes. Yes, you'll miss the initial spike. You'll also miss getting liquidated on a fake-out. The real institutional re-positioning happens after the headline reaction exhausts itself. That first candle is almost always noise.
Step 3 — Read the actual report, not the ticker. Open the BEA GDP release directly. Two specific numbers matter: (a) the current quarter print vs. consensus, and (b) the prior quarter revision. If the prior revision moved by more than 0.4%, that's a narrative-altering event regardless of what the headline print says.
Step 4 — Assess narrative shift, not beat/miss. Ask: does this print change the multi-quarter growth trajectory, or does it just slightly beat a number that was already baked into price? A 0.2% beat on a downward-revised trend is bearish, full stop. A 0.3% miss following an upward-revised trend may actually be bullish if institutional positioning was already de-risked.
Step 5 — Return to your pre-marked structure. After the 30-minute window, price should be settling. Does it return to your discount zone or your premium zone? Is it respecting the OB you marked last night? If the structure is holding, the trade is still valid — now you have the macro context confirming or invalidating the thesis, rather than the other way around.
This framework doesn't require you to be faster than algos. It requires you to be smarter about which data point actually matters. That's the actual edge in applying smart money concepts to high-impact macro releases. For a framework on handling news volatility in ranging conditions, the [premium/discount arrays piece](/trading-insights/2026-04-04-how-to-trade-ict-premium-discount-arrays-during-april-s-volatility-squeeze-before-summer-doldrums hit) walks through the same structural approach in a different context.
And if you want to see how this mental framework applies to the Q2 2026 market structure we've been navigating, the Q2 2026 market structure shifts breakdown is worth reading alongside this one — a lot of what's been tripping traders up this quarter comes back to the same anchoring problem, just in a different disguise.
The Number You Should Ignore Is the One on Your Screen
Here's the contrarian truth that a decade of watching these releases has drilled into me: the most dangerous number in a GDP report is the one that gets broadcast first. Not because it's wrong — but because it's incomplete, and your brain treats it as the whole story.
Retail traders lose money on GDP day not because they're bad at technical analysis. They lose because they're solving a speed problem that doesn't exist (trying to react faster to the headline) instead of solving an information-depth problem that does (understanding which part of the report just changed the institutional narrative).
Smart money concepts, applied properly, pull you out of the reaction loop entirely. Structure is structure. Liquidity is liquidity. A GDP number doesn't move where sell-stops have been accumulating for three days. It just determines which direction the big players use to collect them.
Know that. Stay in the structure. Read the revision.
If you want to work through how to apply this kind of thinking systematically — not just on GDP days but across the full macro calendar — the coaching plans page has details on what each level covers. The difference between the Lite and Full Mentorship tracks comes down to how deep you want to go on macro context within the ICT framework. Or if you'd rather figure out whether it's the right fit first, book a free discovery call and we can talk through where you currently break down on news days specifically.
Harvest Wright
ICT Trading Coach · 10+ Years Experience
Harvest specializes in ICT methodology and has helped traders pass prop firm challenges, develop consistent strategies, and build the psychology needed for long-term profitability.
Book a Free Discovery Call →Master Your Trading Psychology
Psychology is 80% of trading. Our coaching includes dedicated psychological coaching sessions.
See Coaching PlansFree ICT Trading Checklist
The exact checklist I use before every trade. Get it free.